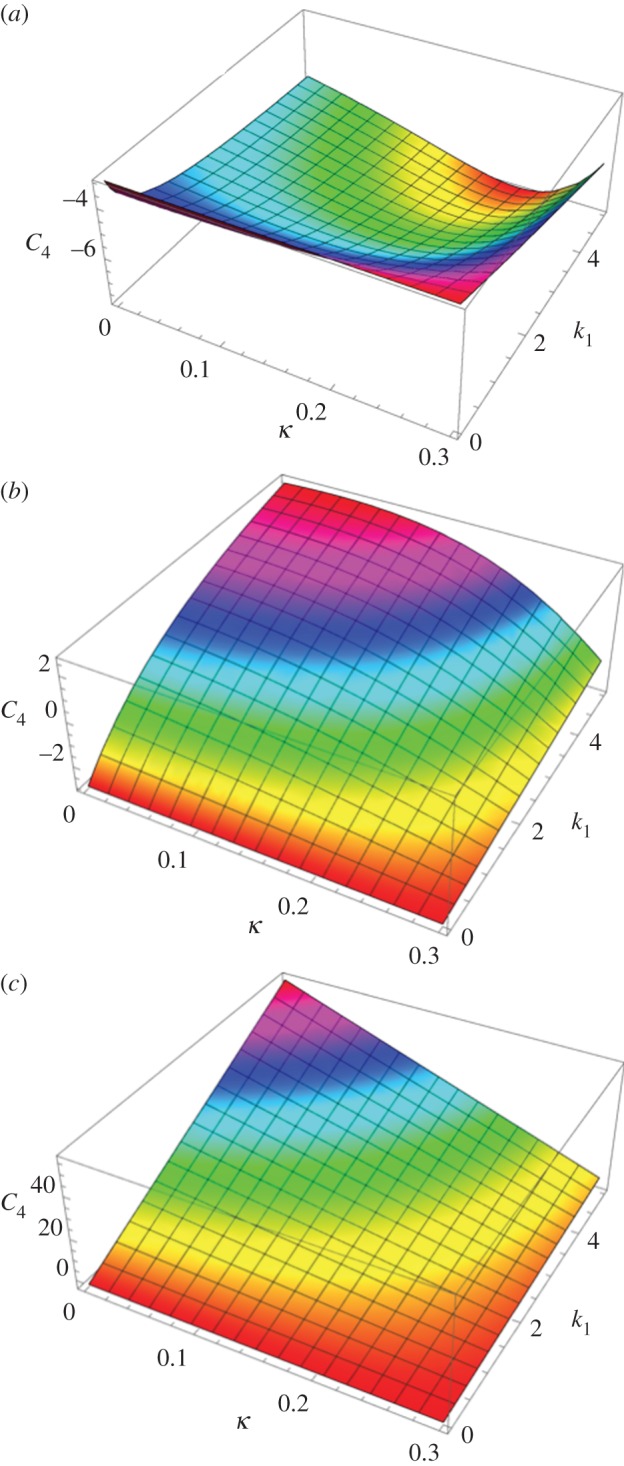
Figure 6.

The initial curvature coefficient C4 deduced from the G–O–H model, for orientation of the fibre perpendicular to the stretching direction (θ0 = π/2) (a), randomly distributed θ0 = π/4 (b) and parallel to the force θ0 = 0 (c) as a function of k1 and of the dispersion coefficient κ (according to the definition given in equation (4.21)). Note the extreme sensitivity of this coefficient to k1, which is equal to C4 = −3 for k1 = 0 (neo-Hookean value) and reaches C4 = 45 for k1 = 4, whereas for high levels of dispersion, which coincides with κ = 1/3, we get C4 = −3.
