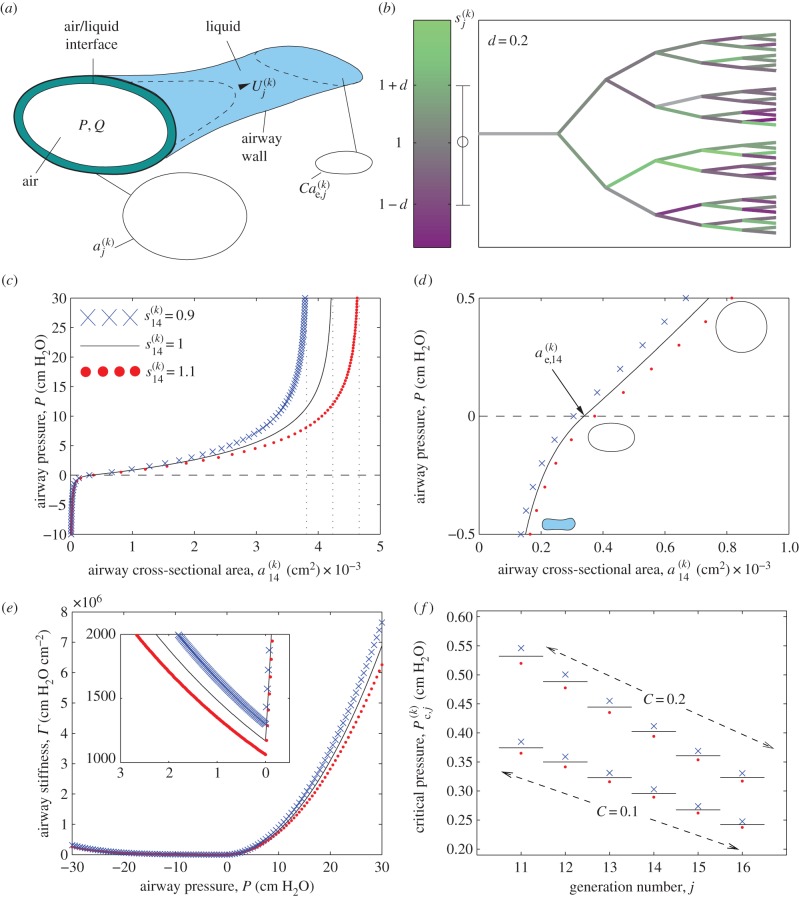
Figure 1.
Set-up of the mathematical model: (a) sketch of an individual airway during recruitment; (b) typical airway tree where individual airways are shaded according to their value of  , where the colour bar highlights the distribution of shading and the error bar shows 1 s.d. from the mean (darker shades represent narrower, stiffer airways); (c) ‘tube law’ for generation 14 showing the transmural pressure as a function of airway cross-sectional area, where
  (solid line). Also shown are the cases where
  ; (d) close-up of the ‘tube law’ for generation 14; (e) airway stiffness in generation 14 for the three cases shown in (c), with the inset showing a magnified view; (f) threshold opening pressure for airways in each generation of a homogeneous airway network for
  (solid line),
  (filled circles) and
  (crosses) for two levels of initial airway collapse (C = 0.1 and C = 0.2).

