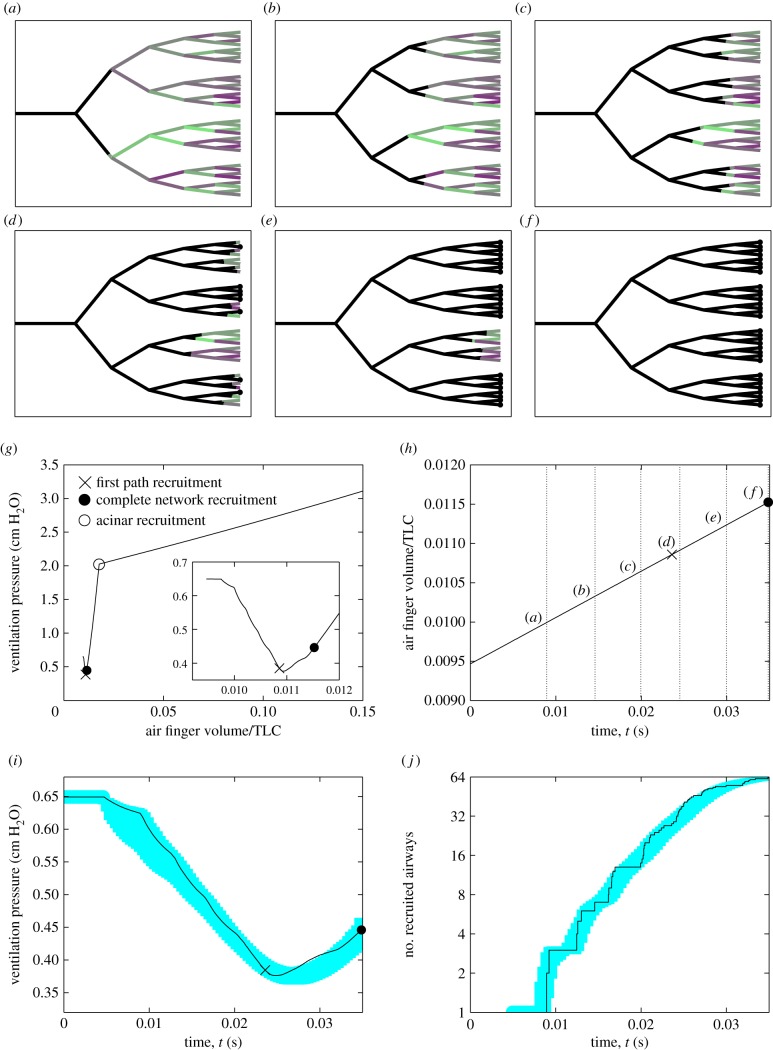
Figure 2.
Typical recruitment event with fixed tidal volume VT = 10 ml kg−1 for C = 0.1: (a–f) snapshots of recruitment of the network shown in figure 1b at six approximately equally spaced time intervals (labelled on (h)), where black lines illustrate the air finger; (g) pressure–volume curve during ventilation, with a close-up during recruitment (inset); (h) time-trace of air finger volume during recruitment; (i) a time-trace of airway pressure during recruitment; (j) time-trace of the number of recruited airways. The shaded regions in (h–j) correspond to 1 s.d. from the mean for 100 repeated simulations. In (h–j), the cross represents the time the first passage through the network is recruited, the filled circle marks complete recruitment and the open circle shows the first opening of the acini. Dotted lines on (g–i) represent the times for the six snapshots shown in (a–f). Other parameters for this simulation are chosen as in table 1.

