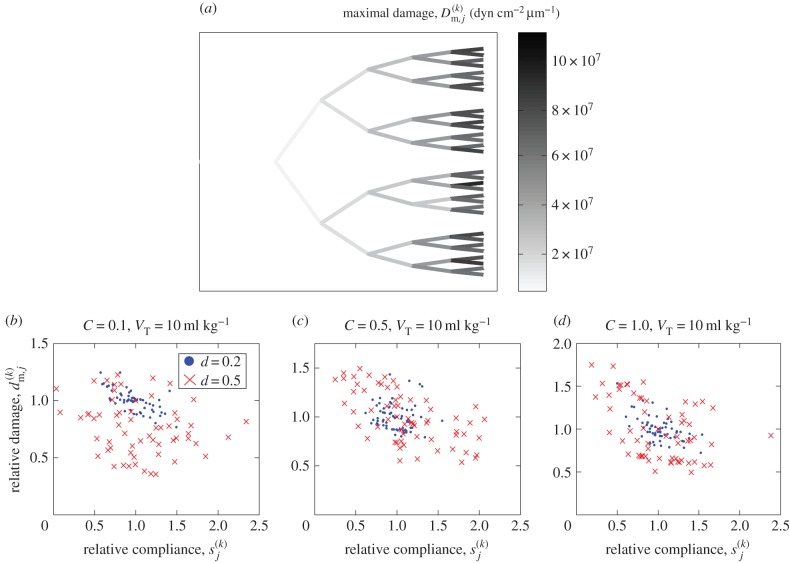
Figure 5.
Relationship between the distribution of airway stiffness and the subsequent airway damage for the baseline simulation shown in figure 2: (a) the six-generation airway tree, shaded according to the maximal pressure gradient in the liquid during recruitment of that generation, providing a measure of airway damage. Scatterplots of the airway stiffness (x-axis) compared to the relative damage to that airway compared to the mean for that generation (y-axis) for particular examples with VT = 10 ml kg−1 and d = 0.2 (filled circles) and d = 0.5 (crosses) for (b) C = 0.1; (c) C = 0.5; (d) C = 1.0.

