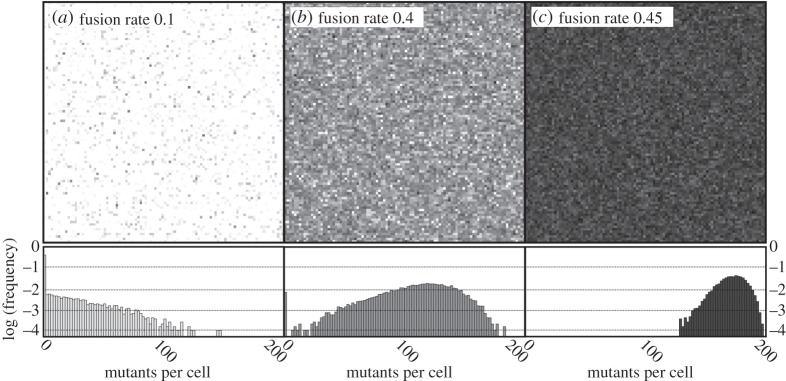
Figure 5.

Schematic of the population in three equilibrium states with individual pixels representing one of 10 000 individuals each. The shade corresponds to the number of mutants m. The number of endosymbionts per cell is M = 200, selfish advantage of the mutants is set to k = 0.2 (see figure 4b for the mean population fitness). Note the sudden proliferation of mutants between panels (b) and (c) corresponding to the fast transition to the low-fitness state in figure 4b. As we demonstrate in the histograms below, the transition is mostly owing to reduced variation and extinction of the mutant-free part of the population.
