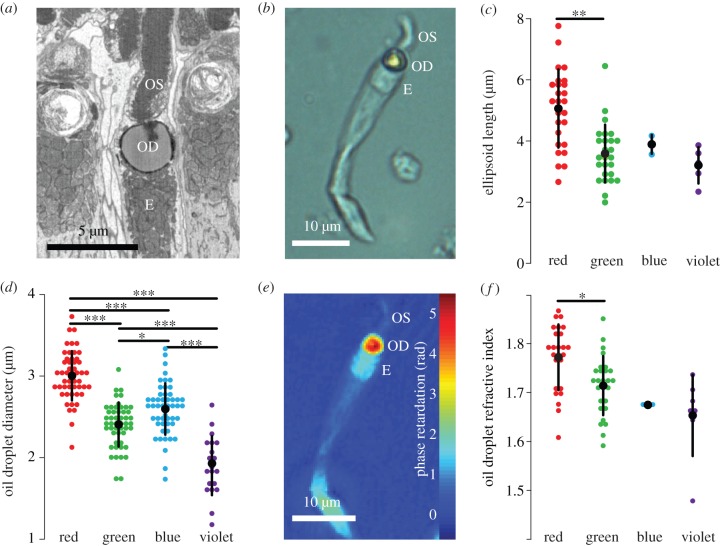
Figure 1.
Morphology and refractive indices of the chicken single cone photoreceptor. (a) A single cone from serial block face scanning electron microscopy shows the E, ellipsoid; OD, oil droplet and OS, outer segment. (b) A dissociated green single cone under bright-field microscopy. (c) Lengths of the ellipsoids for all four cone types measured by bright-field microscopy. (d) Oil droplet diameter for all four cone types measured by bright-field microscopy. (e) A phase retardation image of a dissociated single green cone (seen in bright field in (b)). (f) The real part of the oil droplet refractive index measured at 660 nm. Only the difference between the red and green cone is significant (p = 0.011). Large black dots show mean values; error bars represent 1 s.d. Significance bars show the results of Tukey's honest significant difference (HSD) test with the following p-values: *p < 0.05, **p < 0.01, ***p < 0.001.

