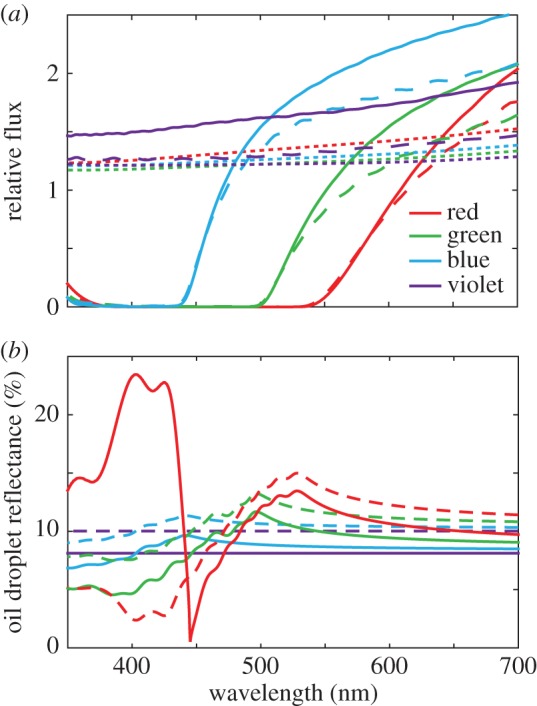
Figure 4.

Optical transmission in single cone photoreceptors. (a) Relative flux calculated in FDTD simulations for differing combinations of organelles; dotted lines show outer segment only, dashed lines with an oil droplet and solid lines are with all three elements. (b) Percentage reflectance of the front hemisphere of the oil droplet of each cone type. Dashed lines show reflectance without an ellipsoid (n1 = 1.35) and solid lines with an ellipsoid (n1 = 1.43). The discontinuity in the curve for the red cone oil droplet in the presence of the ellipsoid (solid red line) below 450 nm occurs where n1 > n2.
