Figure 2.
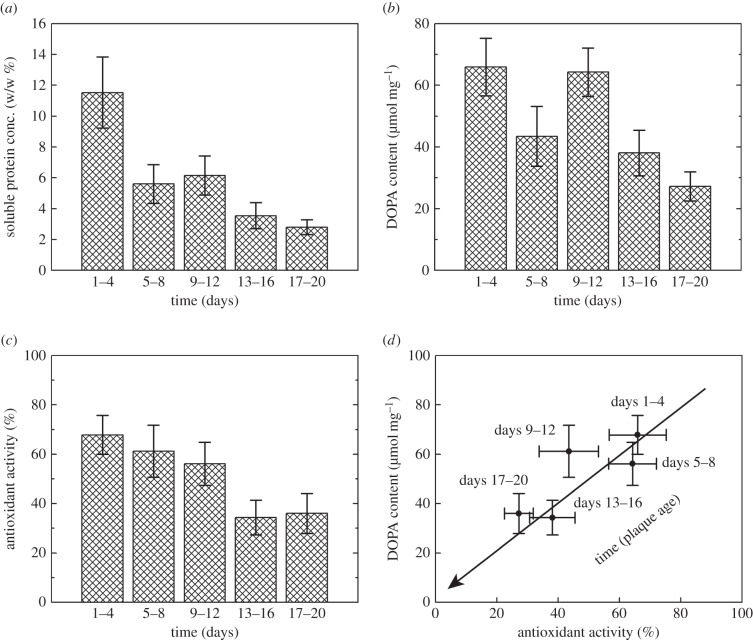
Plaque ageing as indicated by (a) soluble protein concentration, (b,d) DOPA content and (c,d) antioxidant activity decreasing with plaque age. (a) Soluble protein (plaque extract) concentration decreasing as determined by the Bradford assay using Coomassie Brilliant Blue in a 1 : 2 ethanol : phosphoric acid solution. Ordinates denote weight/plaque dry weight % over time. (b,d) DOPA content of plaque extracts decreasing as determined by the borate-shift assay (296 nm) in acidic (pH approximately 2, 0.1 M HCl) versus borate-buffered (pH 8, 0.1 M sodium borate) solutions over time. Ordinates denote mmol DOPA per milligram of protein. (c,d) Antioxidant activity of plaque extracts decreasing as determined by the DPPH assay (515 nm) using a citric acid–phosphate buffer (68 mM citric acid monohydrate, 34 mM sodium phosphate dihydrate, 0.3% (v/v) Triton X-100, pH 3.0), 100 µM DPPH and 5% methanol (v/v). Ordinates denote normalized % of antioxidant activity ((sample absorbance change—negative control absorbance change)/(largest absorbance change—negative control absorbance change) × 100) over time. (d) Antioxidant activity and DOPA content in plaque extracts correlate (R2 = 0.66) linearly (1 : 1) over time. The arrow indicates the direction of increasing plaque age. (a–d) Data are represented as means and standard errors (n = 13–20).

