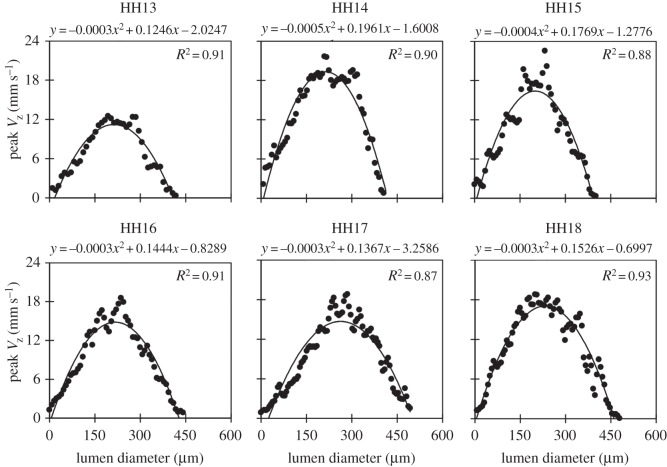
Figure 2.
Velocity profiles across the diameter of the OFT during maximum flow for each stage imaged (HH13 to HH18). Vertical velocity (VZ), depicted for representative embryos at each stage along a line that passes through the sampling point, shows a parabolic-like profile; a second-order polynomial fit and R2 value are also provided.

