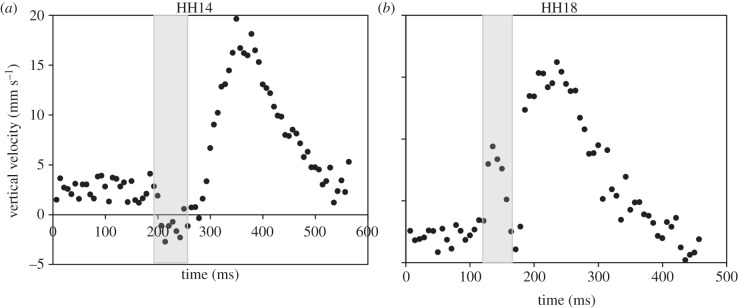
Figure 5.

Velocity versus time traces of example embryos. (a) Vertical flow velocity at HH14 showing backflow (negative velocity, shaded) immediately prior to the systolic phase. (b) Velocity at HH18 showing a forward flow surge (shaded) immediately prior to the main flow during the systolic phase.
