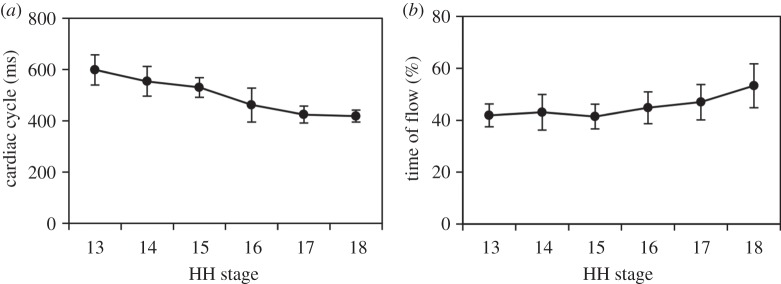
Figure 6.

Summary of cardiac cycle results over advanced developmental stages from HH13 to HH18 (n = 10 at each stage). (a) Cardiac cycle (ms) and (b) time of flow (%). Average measures are shown at each stage with s.d.

Summary of cardiac cycle results over advanced developmental stages from HH13 to HH18 (n = 10 at each stage). (a) Cardiac cycle (ms) and (b) time of flow (%). Average measures are shown at each stage with s.d.