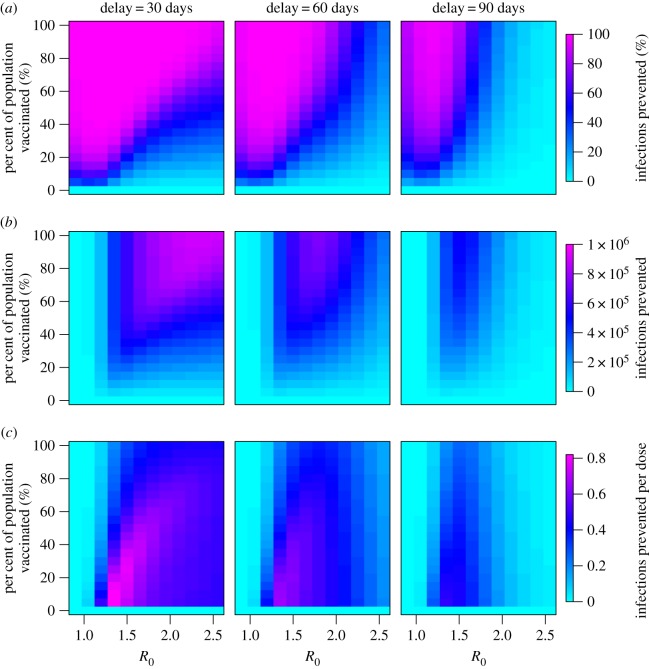
Figure 2.
The number of cholera infections prevented via reactive vaccination in an epidemic setting as a function of R0 and the percentage of the population that is vaccinated. (a) Percentage of infections prevented, (b) total number of infections prevented and (c) number of infections prevented per vaccine dose are given for vaccination campaigns starting 30, 60 or 90 days after the start of the outbreak. N = 100 000 and 1/δ = 1/5 d−1.

