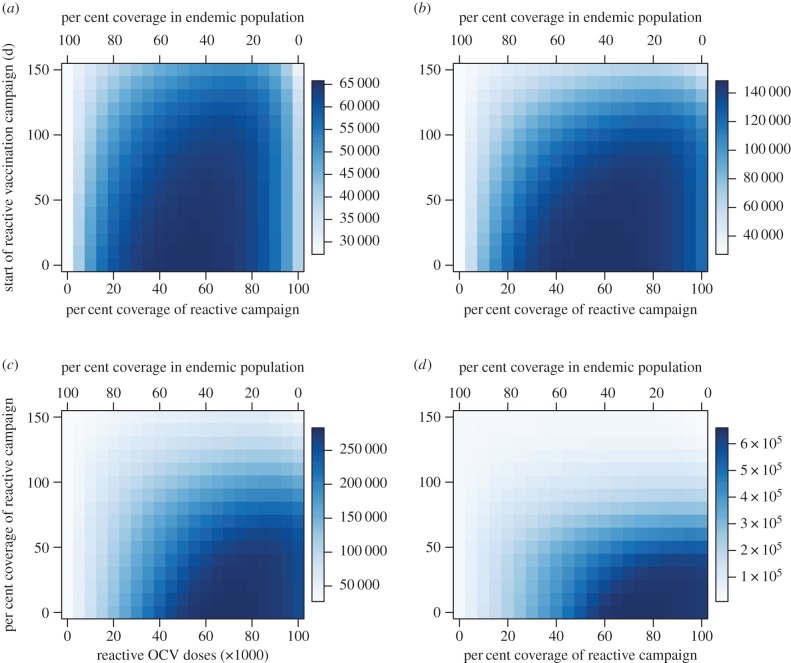
Figure 4.
Total number of cases prevented between the epidemic and endemic settings as a function of the percentage of OCV doses allocated to reactive vaccination and the expected delay in reactive vaccination. Scenarios assume a stockpile of 2 million doses and an epidemic population at risk of 1 million. Epidemic growth rates for (a–d) same as in previous figure.

