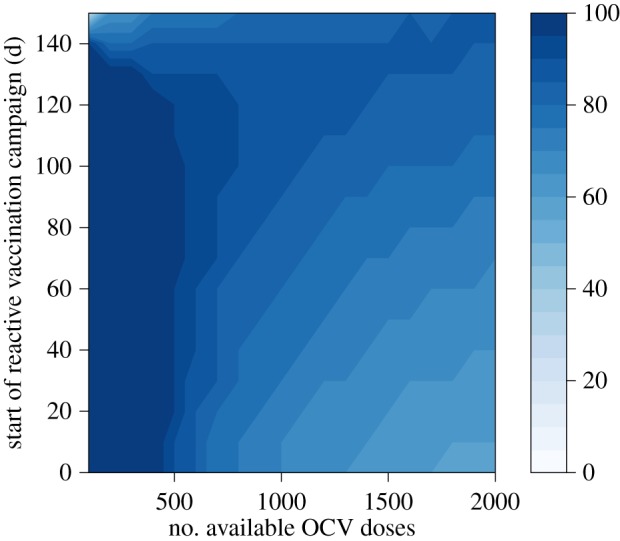
Figure 7.

Optimal allocation of OCV doses between epidemic and endemic settings as a function of the number of doses remaining in the stockpile and the expected delay to the start of the reactive vaccination campaign. Colour scale represents the optimal percentage of available doses allocated to reactive vaccination. Epidemic growth rate of 0.054 d−1.
