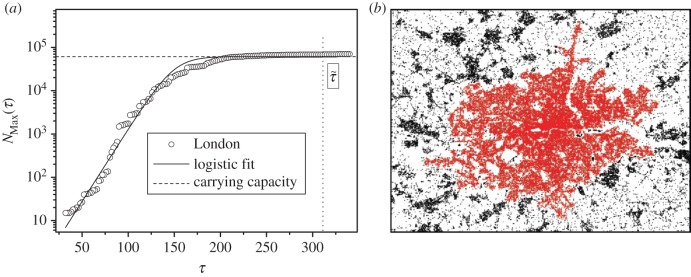
Figure 1.

Logistic growth for the maximum cluster size in a clustering process: the condensation threshold. (a) Maximum cluster size NMax(τ) as a function of the threshold τ for Greater London on a semi-log plot. The solid line is the logistic function fit of equation (2.1). The dashed line represents the carrying capacity C, while the dotted line shows the condensation threshold  defined as the threshold where NMax(τ) = C. (b) The maximum cluster (red) at the condensation threshold for London.
