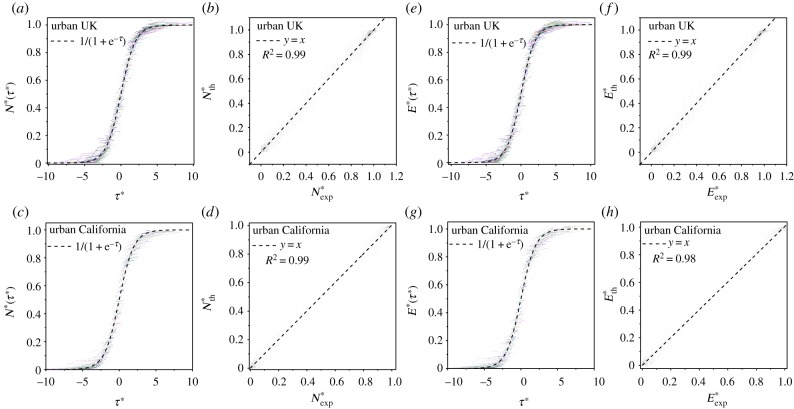
Figure 3.
Growth curve collapse for the cities in the UK and in California. (a,c) Rescaled maximum cluster size  as a function of the rescaled threshold
  for the largest 61 cities in the UK and for the largest 52 cities in California. The dashed curve is
  (b,d) In order to evaluate the goodness of the collapse of the curves in (a,c), we plot in the horizontal axis the
  values for the cities in the UK (b) and in California (d) and in the vertical axis, the estimated value via the logistic function
  Then we calculate the R2 value of the resulting points with the dashed curve y = x and we find that R2 > 0.99 for both UK and California cities. (e–h) The same methodology as explained for (a–d) is applied for the number of street segments E(τ) for the cities of the UK and California. In this case, we find that the quality of the logistic collapse is given by R2 > 0.99 for the UK and R2 > 0.98 for California.

