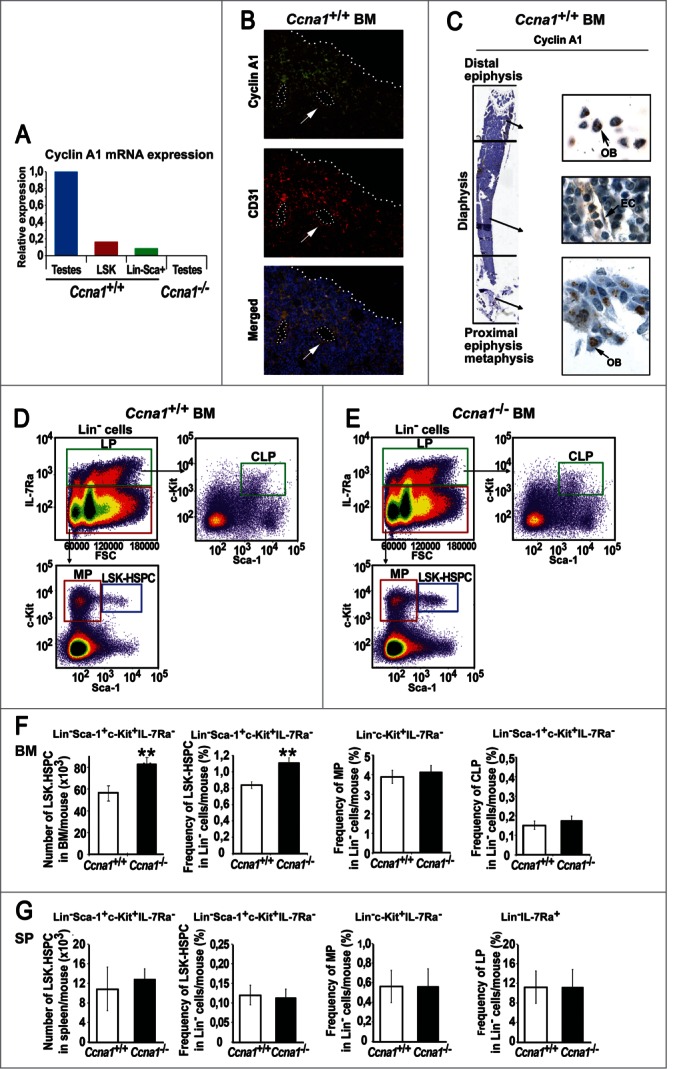
Figure 1.

Loss of cyclin A1 function results in the increased numbers of HSPC in the BM of Ccna1−/− mice. (A) Expression of cyclin A1 mRNA in sorted Lin−Sca-1+c-Kit+ HSPC (LSK), Lin−Sca-1+ lymphoid progenitors, testis tissues (testes) from Ccna1+/+ mice and testis tissues (testes) from Ccna1−/− mice was determined using semi-quantitative RT-PCR. Relative expression from 3 independent experiments is shown. (B) Representative photographs show the distribution of cyclin A1 in endothelial cells of perivascular blood vessels that are stained positive for CD31, as determined by immunofluorescence analysis. Antibody against cyclin A1 was conjugated with Alexa Fluor 488 (green) and antibody to CD31 was conjugated Alexa Fluor 594 (red), 4′,6-Diamidino-2-phenylindole (DAPI) showing the nucleus staining is in blue. Cells that are co-stained with cyclin A1 and CD31 are indicated as “Merge.” (C) Representative pictures of the femur long bone of a Ccna1+/+ mouse, stained with antibody against cyclin A1. The micro-anatomic zones including proximal, distal epiphyses, metaphysis and diaphysis regions are indicated. Osteoblasts (OB) and endothelial cells (EC) are indicated. (D and E) Representative FACS plots of isolated BM Lin− cells from Ccna1+/+ and Ccna1−/− mice are stained and sorted with the cell surface markers as indicated. (F) Total number and frequency of subpopulations of BM cells per mouse that were quantified by FACS analysis are shown in the graphs. Data represent mean values + SEM (n = 19 pairs of mice from each genotype). (G) Total numbers and frequency of subpopulations of haematopoietic cells from spleen (SP) per mouse that are quantified by FACS analysis are shown. Data represent mean values + SEM (n = 3 pairs of mice from each genotype). The statistically significance is indicated by “*.” One “*” indicates that P ≤ 0.05, Two “**” indicates that P ≤ 0.01.
