Figure 2.

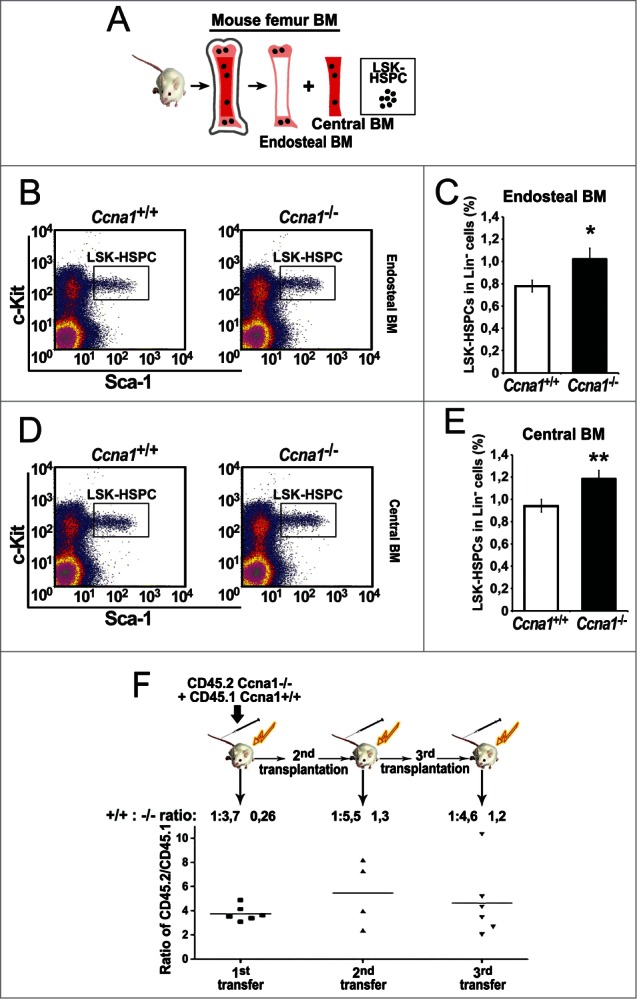
The frequency of HSPC is increased in the endosteal and central BM regions from Ccna1−/− compared with that of litter-mate Ccna1+/+ mice. Ccna1−/− HSPC display increased proliferation rate compares with that of Ccna1+/+ HSPC. (A) schematic illustration of the procedures to isolate and sort LSK-HSPCs from endosteal and central BM regions. (B and D) Representative FACS raw data from the assessment of LSK-HSPCs in the endosteal vs. central BM zones from Ccna1−/− and Ccna1+/+ littermate controls are shown. (C and E) The frequency of LSK-HSPCs within Lin− population in the endosteal regions in (C) and in the central BM region in (E) from Ccna1−/− and Ccna1+/+ mice is shown. Mean frequency of LSK-HSPC in the endosteal zone per Ccna1+/+ mouse = 0.78%, mean frequency of LSK-HSPC in the endosteal zone per Ccna1−/− mouse = 1.02%, difference = 0.24, 95% CI = 0.13 to 0.24%, p = 0.018, mean frequency of LSK-HSPC in the central BM zone per Ccna1+/+ mouse = 0.94%, mean frequency of LSK-HSPC per Ccna1−/− mouse = 1.19%, difference = 0.24, 95% CI = 0.14 to 0.18%, p = 0.01. (n = 3 mice of each genotype). (F) A cartoon depicting the procedures of assessing the competitive repopulation ability of Ccna1−/− BM using serial BM transplantations is shown in the upper panel. The competitive transplantation assay is shown in the lower panel. The recipients from the primary transplantation were found to have a mixed percentage of donor chimeras, with an average ratio of CD45.2:CD45.1 being 3.7:1 (+0.26) at 4 months post-transplantation. The ratios of CD45.2:CD45.1 for secondary: 5.5:1 (+1.3) and tertiary rounds of serial transplantation: 4.6 (+1.2) are indicated. (n = 4–6 recipients per round of transplantation). Data represent average CD45.2:CD45.1 ratios + SEM.
