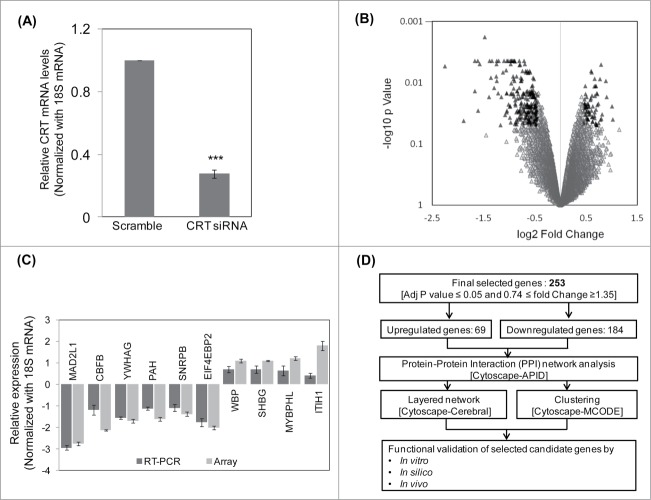
Figure 1.
Microarray, qRT-PCR validation and the pipeline of the experimental strategy. (A) HepG2 cells were transfected with the scramble or CRT siRNA (10 nM) for 24 h. On termination of incubation, CRT levels were estimated by qRT-PCR using CRT specific primers. (B) RNA as in “A” was subjected to microarray analyses using Illumina Human HT-12 V3 expression Bead chip arrays. Genes differentially regulated (p < 0.5) are represented as black triangles in a volcano plot with the up- and downregulated genes being represented on either side of the central axis. (C) RNA from scramble and CRT siRNA treated HepG2 cells were subjected to qRT-PCR toward validation of differentially altered genes as obtained from the microarray. All fold changes were significant at p < 0.05. (D) Computational and experimental pipeline of the strategy followed for the altered genes. Values presented are means ±SEM of 3 experiments. ***p < 0.001 as compared to scramble transfected cells.

