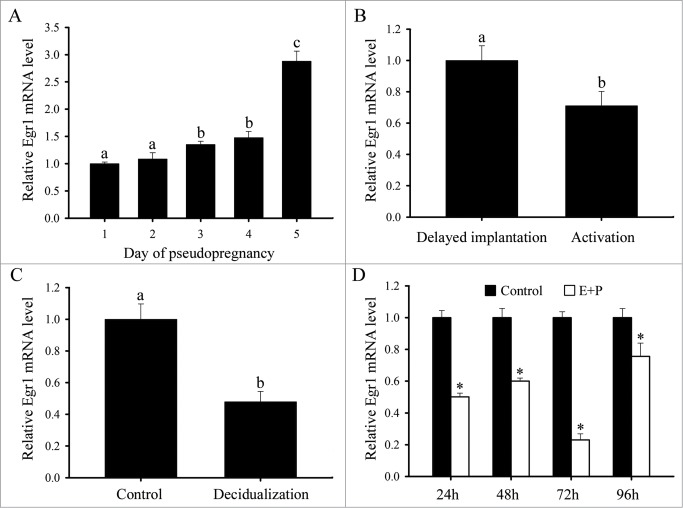
Figure 4.
Real-time PCR analysis of Egr1 expression in mouse uteri. (A) Real-time PCR analysis of Egr1 expression in mouse uterus on days 1-5 of pseudopregnancy. Different letters on 2 bars show a significant difference between these 2 groups. (B) Real-time PCR analysis of Egr1 expression in mouse uterus during delayed implantation and activation. (C) Real-time PCR analysis of Egr1 expression in mouse uterus under artificial decidualization. (D) Real-time PCR analysis of Egr1 expression in in vitro decidualization of uterine stromal cells. Asterisks denote significance (P < 0.05) from the control group. E stands foRestrogen; P stands for progesterone.

