
Figure 4. Random forest statistics analysis.
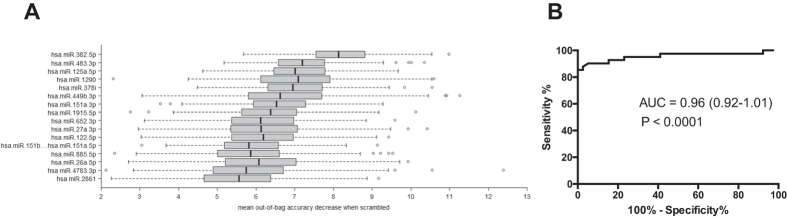
Figure (A) presents the top 16 miRNAs that separate APAP-TOX from APAP-no TOX in the training set. miRNAs were ranked according to the marginal decrease in out-of-bag prediction accuracy when the gene’s expression measurements are scrambled. Figure (B) Receiver operator characteristic curve displaying the performance of the top 16 miRNAs from the training set with regard to distinguishing APAP-TOX from APAP- no TOX in the test set.