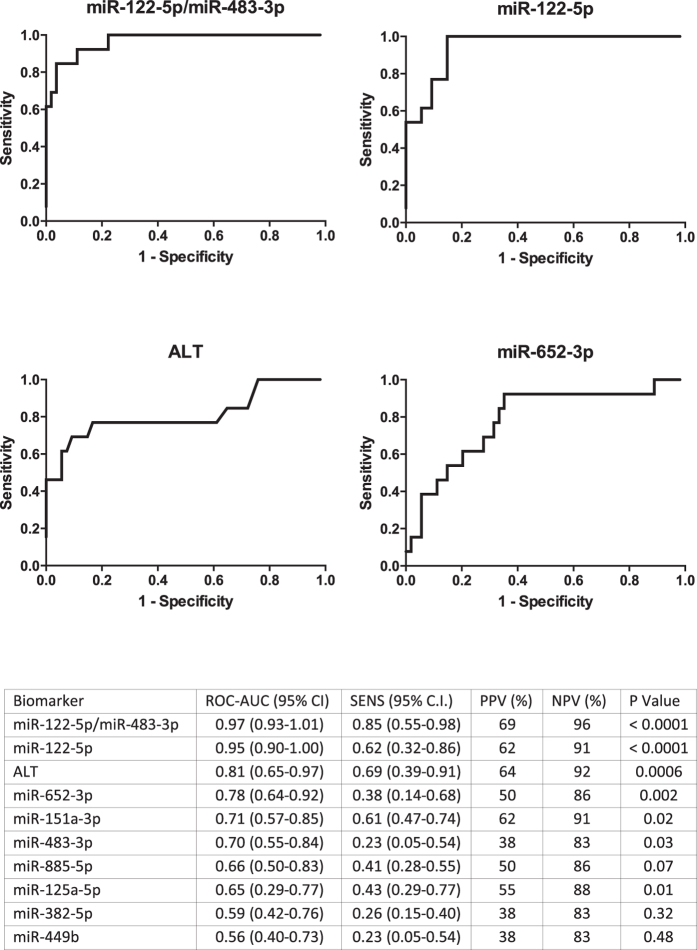
Figure 7. Biomarker sensitivity - ROC curve analysis supports the potential for miR-122-5p to predict the development of ALI.
ROC analysis was calculated to determine the potential for plasma miRNAs and serum ALT activity to predict the development of TOX at first presentation to hospital following acetaminophen overdose. TOX was defined as >3xULN ALT activity during hospital admission. The ROC curves of the 4 most accurate predictors are presented. AUC (area under the curve with 95% CI), sensitivity (SENS at 90% specificity) with 95% CI, positive and negative predictive values (PPV and NPV) and statistical significance for AUC value is presented in table. The miRNAs are normalized by miR-1287.

