Figure 2.
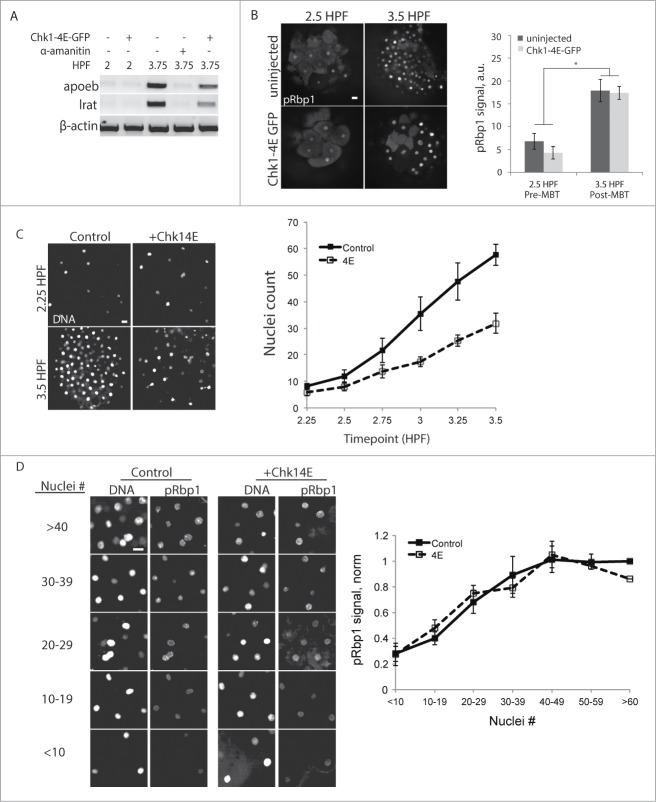
For figure legend, see page 3831.Figure 2 (See previous page). Transcriptional activity is coupled to the N:C ratio. (A) Expression of the zygotic genes apoeb and lrat were monitored by RT-PCR at the times indicated, with or without Chk1-4E-GFP expression. α-amanitin injected embryos serve as a transcriptionally silent post-MBT control. β-actin is the internal control. (B) Embryos with our without Chk1-4E-GFP expression were fixed and stained for phosphorylated RNA Polymerase II (pRbp1) and DNA at the indicated times. pRbp1 staining was quantified and averaged over multiple embryos (n ≥ 10). Error bars indicate s.e.m., *P < 0.05. (C and D) Control and Chk1-4E-GFP embryos were fixed and stained for DNA and pRbp1 at 15-minute intervals between 2.25 and 3.5 HPF. Representative images show nuclei density at the first and last timepoints (C), and the plot shows average nuclei density (n ≥ 37) at each timepoint, pooled from 4 independent experiments. Chk1-4E-GFP embryos have fewer nuclei as a result of elongated cell cycles. pRbp1 staining was calculated for embryos grouped by nuclei density (D). Representative images are shown for each group, and the plot shows average pRbp1 staining intensity for each group, calculated as a fraction of the ≥60 control group (n ≥ 9 for Chk14E with >50 nuclei, n ≥ 13 for all other groups). Error bars indicate s.e.m. All scale bars 20 μm.

