
Figure 2. Representative gross views and brain slices showing regions with BBB-opening, as evidenced by Evans blue dye leakage.
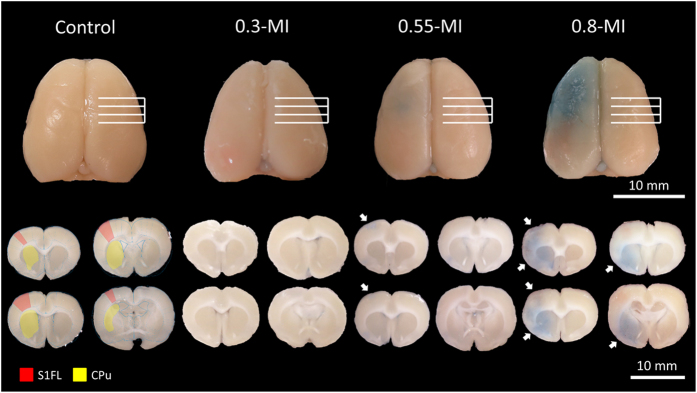
Leakage was found in the left S1FL for both the 0.55- and 0.8-MI groups, but not for the control or 0.3-MI groups. The red and yellow regions denote left S1FL and caudate putamen (CPu), respectively. The white arrows indicate regions with Evans blue dye leakage.