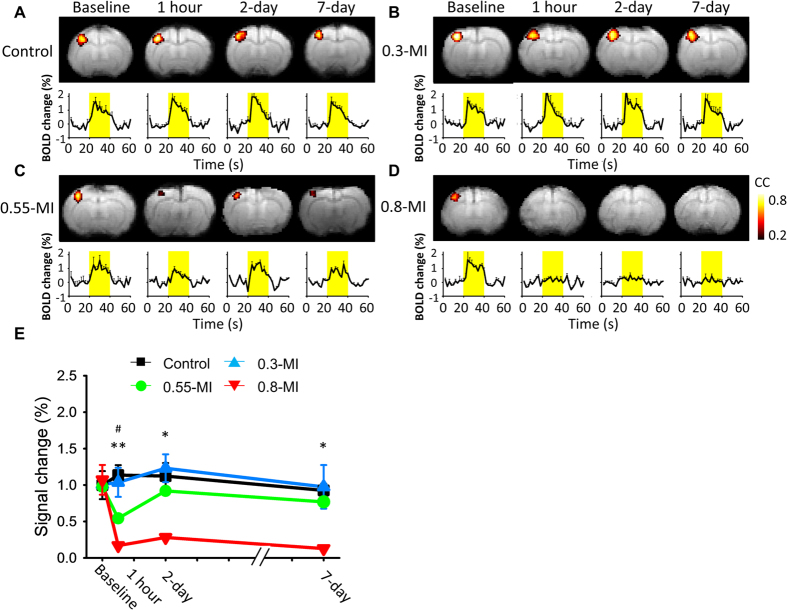
Figure 5. Spread and magnitude of the BOLD responses.
(A) Control group. Yellow bars indicate the stimulation periods. (B) 0.3-MI group. (C) 0.55-MI group. (D) 0.8-MI group. (E) Time course of the effects on BOLD responses. The neuromodulation effect was reversible for the 0.55-MI group, but not for the 0.8-MI group. #denotes a significant difference between the 0.55-MI and control groups. *denotes a significant difference between the 0.8-MI and control groups.

