
Figure 3. The concentration of intracellular PLP and cadaverine productivity of the BL-CadA, AST1, AST2, and AST3 strains.
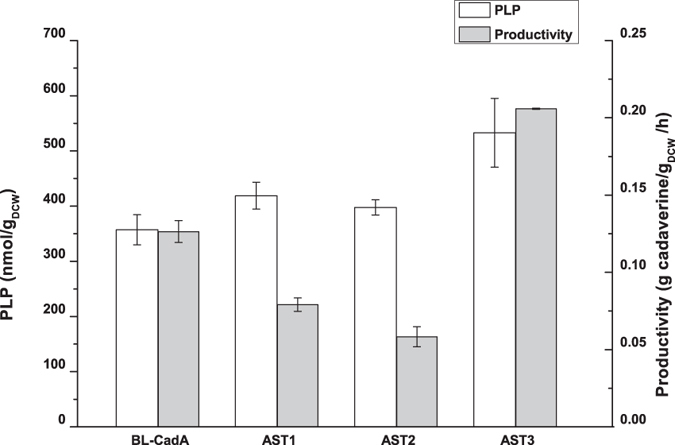
BL-CadA, E. coli BL21(DE3) harbouring the pETDuet-CadA plasmid (PT7-controlled cadA); AST1, E. coli BL21(DE3) harbouring the pET-cadA-TrcST plasmid (PT7-controlled cadA and Ptrc-controlled pdxST); AST2, E. coli BL21(DE3) harbouring the pET-cadA-BADST plasmid (PBAD-controlled pdxST and PT7-controlled cadA); AST3, E. coli BL21(DE3) harbouring the pETDuet-CadA and pCWJ-pdxST plasmids (Ptrc-controlled pdxST). The samples were collected after 6 h of induction with IPTG. The error bars indicate the standard deviation, as determined from triplicate experiments (three independent bacterial cultures).