Figure 2.
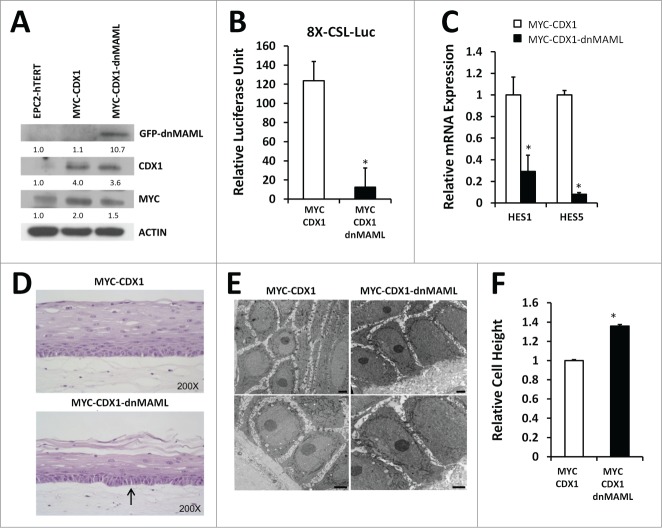
Inhibition of Notch signaling in esophageal epithelial cells changes basal cell morphology in 3D cultures. (A) Western blotting for GFP (dnMAML), MYC and CDX1 in EPC2-hTERT, MYC-CDX1 and MYC-CDX1-dnMAML cells. (B) Luciferase assay with Notch-responsive pGL3–8XCSL reporter vector in MYC-CDX1-ICN1 and MYC-CDX1-ICN1-dnMAML cells, graph represents mean ± SEM (n = 3). Student t-test was performed to determine significance, *P ≤ 0.05. (C) Quantitative PCR (qPCR) for Notch downstream targets HES1 and HES5 in MYC-CDX1 and MYC-CDX1-dnMAML cells. Graph represents mean ± SEM (n = 3) and student t-test was performed to determine significance, *P ≤ 0.05. (D) H&E staining of representative 3D organotypic cultures of MYC-CDX1 and MYC-CDX1-dnMAML cells, arrow indicates elongated cells, (200X Magnification). (E) Electron microscopy of MYC-CDX1 and MYC-CDX1-dnMAML 3D organotypic cultures, scale bars = 0.2 μm. (F) Graph represents relative height of MYC-CDX1 and MYC-CDX1-dnMAML basal layer cells mean ± SEM (n = 4). Student t-test was performed to determine significance, *P ≤ 0.0001.

