
Figure 4.
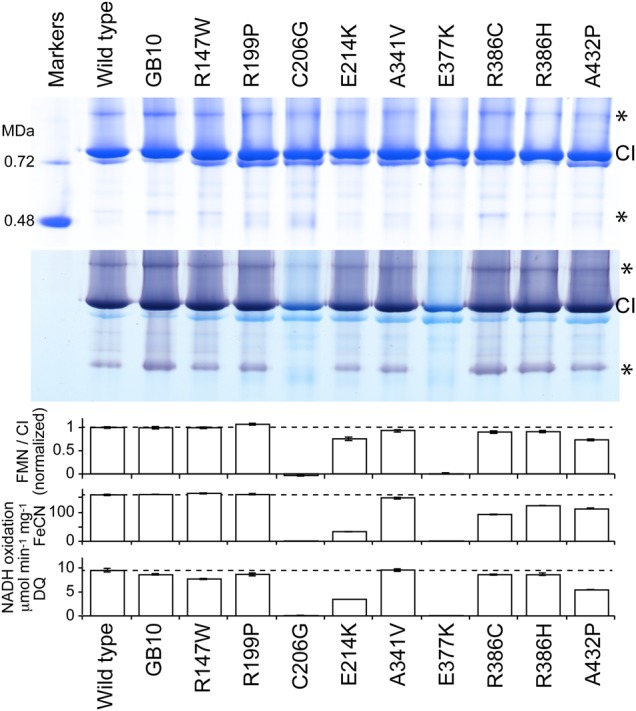
Analyses of nine NDUFV1 variants of complex I isolated from Y. lipolytica. Top: BN-PAGE analyses of Y. lipolytica complex I from the nine variants, alongside enzyme from the parent GB10 strain and the wild-type variant. Eight micrograms of protein was loaded per lane and visualized using Coomassie Blue. Asterisks indicate catalytically-active complex I dimers and subcomplexes. Middle: NADH oxidation by complex I was detected as a purple color using 0.5 mg ml−1 NBT and 120 µm NADH. Bottom: the flavin content of the purified enzymes, relative to the WT variant, equivalent to the number of flavins bound per complex I; the rate of NADH oxidation measured using 100 µm NADH and 1 mm FeCN; the rate of NADH oxidation measured using 100 µm NADH and 100 µm DQ.