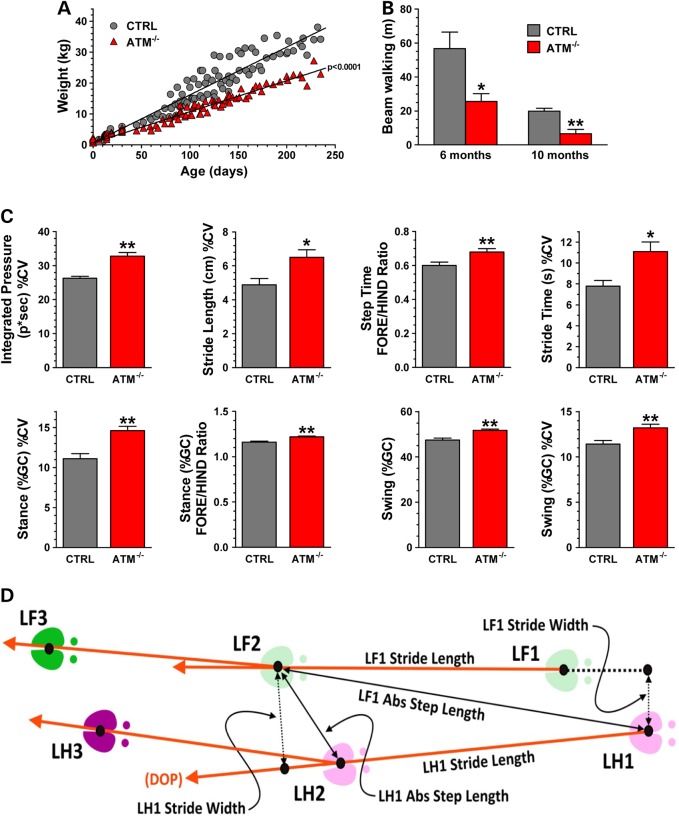
Figure 5.
Impaired growth and ataxia manifestation in ATM−/− pigs. (A) Pig weight was collected weekly over 250 days from controls (CTRLs N = six) and ATM−/− pigs (N = six) female pigs. Each symbol (circle CTRL; triangle for ATM−/−) represents an individual weight measurement. Growth rates analyzed by linear regression and slopes of the fitted lines were analyzed by unpaired t-test (P < 0.0001). The weight difference between CTRL and AT pigs became statistically significant at the 97-day-old (P < 0.01, two-way ANOVA with Bonferroni's post-test for pairwise multiple comparisons). (B) The walking distance over a period of 5 min of age- and gender-matched pigs (N = four per group) was measured on the balance beam at indicated ages (unpaired t-test; *P = 0.0273, **P = 0.0053). (C) The graphs represent the mean value of the indicated variables calculated from 66 walks of six CTRLs and from 61 walks of five ATM−/− pigs collected during several sessions and ± SD among walks of each group. The difference between the two groups was determined by Wilcoxon non-parametric test (*P ≤ 0.05 and ** P ≤ 0.002). (D) The scheme depicts the relationship of spatial measurements stride length, absolute step length and stride width for the left fore (LF) and left hind (LH) hooves. The dimensions are scaled for clarity. DOP, Direction of Progression.

