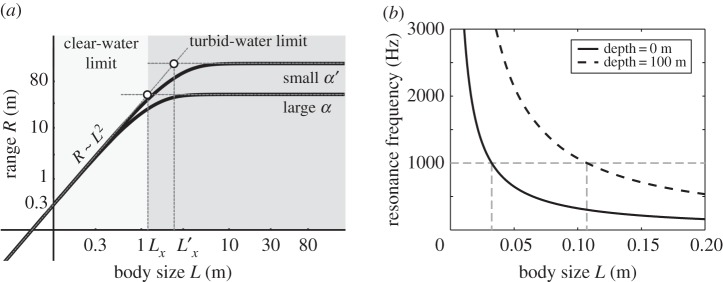
Figure 3.

(a) Visual sensing range scales with body size, L, as R ∼ L2 in the clear-water limit ( ) and as R ∼ constant in the turbid-water limit (
 ). Parameters are C0 = 0.3, Cth,min = 0.05 (adopted from [43]), K = 2.5 × 10⁻⁴ m2, α = 0.04 m−1 [47] (and α′ = 0.01 m−1 for comparison). (b) Relationship of body size and resonance frequency based on equation (6.1) and using a swim bladder size rb = L/10 for an individual at the surface (solid curve) and at 100 m depth (dashed curve). The dashed (grey) horizontal line indicates 1 kHz, below which most sounds generated by marine life are found.
