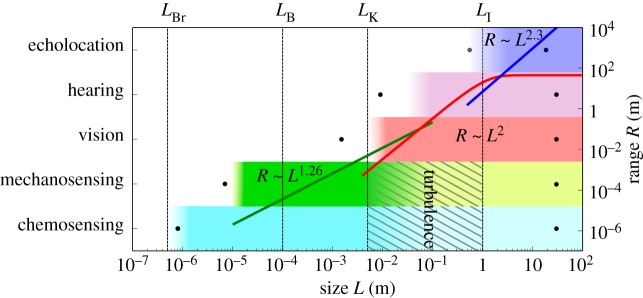
Figure 4.

Upper and lower body size limits and ranges for different senses. Dots denote the largest and smallest sizes known to employ a given sense, and shaded rectangles show the theoretical estimates of the size range in which a sense is expected to work. Green, red and blue curves show the theoretical scaling of sensing range with size for mechanosensing, vision and echolocation, respectively.
