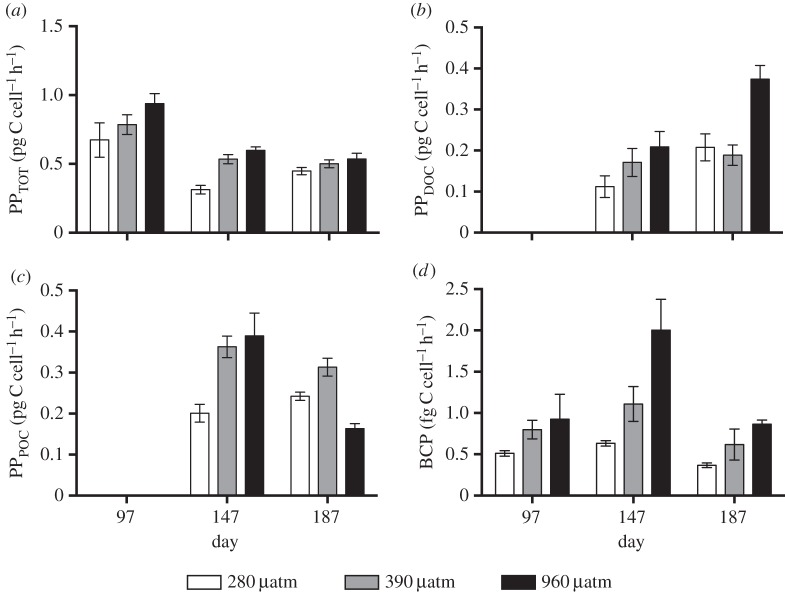
Figure 2.
Carbon production rates of N. lecointei cultures during long-term exposure of three pCO2 levels (280, 390 and 960 µatm). (a) Total primary productivity (PPTOT). (b) Dissolved organic carbon primary productivity (PPDOC). (c) Particulate organic carbon primary productivity (PPPOC) and (d) bacterial carbon productivity (BCP). All values are normalized to cell count and error bars represent standard error (n = 5).

