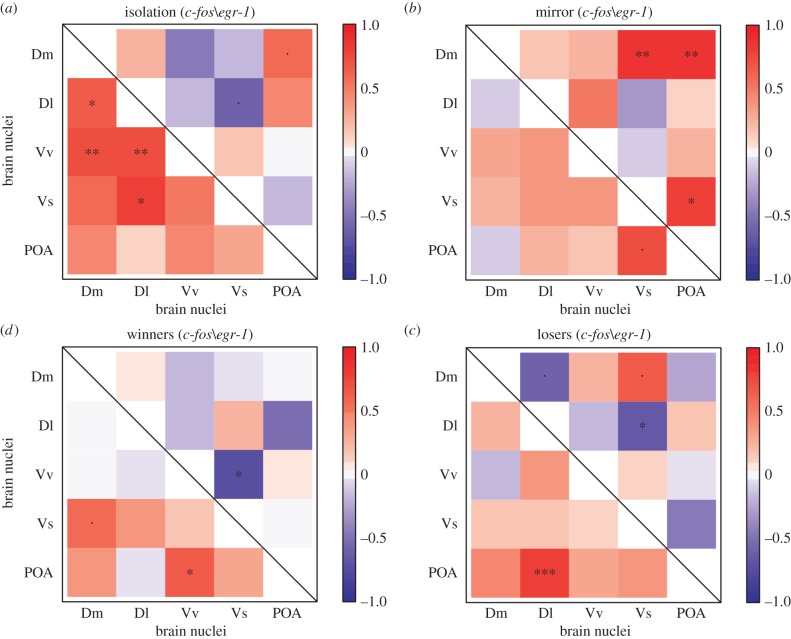
Figure 2.
Functional connectivity in the SDM network as measured by Pearson correlations (r) of c-fos (below the diagonal) and egr-1 (above the diagonal) expression between pairs of brain nuclei (Dm, medial zone of the dorsal telencephalic area; Dl, lateral zone of the dorsal telencephalic area; Vv, ventral nucleus of the ventral telencephalic area; Vs, supracommissural nucleus of the ventral telencephalic area; POA, preoptic area) for each social behaviour state: (a) isolated fish (non-social); (b) mirror-fighters; (c) winners; (d) losers; colour scheme represents r values from −1 (blue) to 1 (red); asterisks indicate significant correlations after p-value adjustment: dot (.) p < 0.1; *p < 0.05; **p < 0.01; ***p < 0.001.

