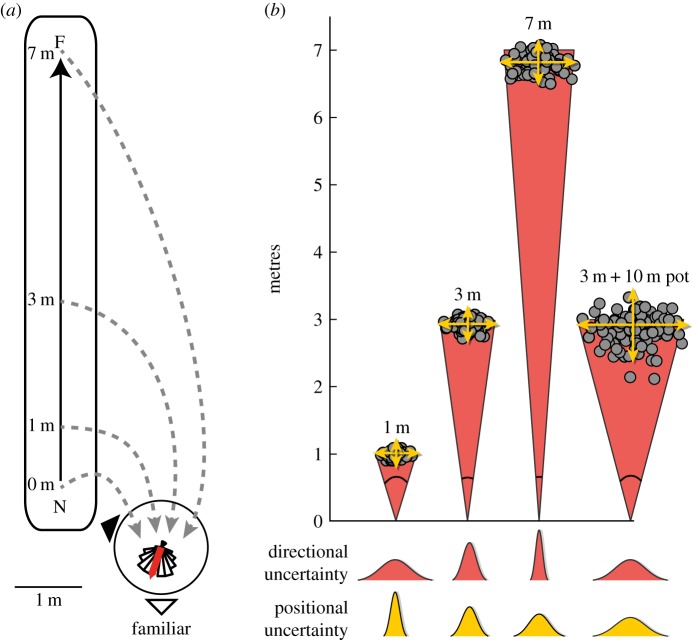
Figure 1.
Experimental protocol and modelling uncertainty. (a) Ants were trained to forage from their nest (N) along a straight route to a feeder (F) 7 m away. Experienced foragers were captured on their outward journey at either 0, 1, 3 or 7 m, provided with food, and released on a goniometer 1.5 m from the nest, and their direction of travel recorded 60 cm from the release point. In experiment 2, some 3 m ants were made to run for an additional 5 min in a pot before testing. (b) Ants will accumulate uncertainty during PI, so the positional variance of their estimate will increase (larger scatter of dots, yellow distributions) with distance. However, as the increase is proportional to distance, the angular error of the estimate (red angles and red distributions) will decrease inversely to distance (see Material and methods). For the pot condition in experiment 2, the additional accumulation of uncertainty should lead to a larger angular error for the same home vector length. The illustrated scatter was produced using a particle filter model (see the electronic supplementary material). (Online version in colour.)

