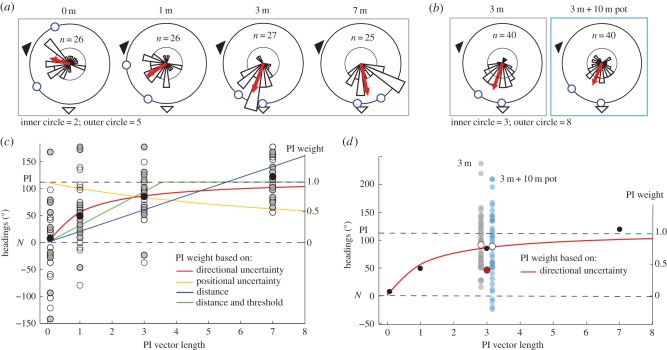
Figure 2.
Ants integrate sensory cues using uncertainty. (a,b) Circular histograms show the orientations taken by ants with various PI lengths (a), and for the 3 m control and 3 m ‘pot’ groups (b). Black and white arrowheads indicate view direction (nestwards) and PI direction, respectively. Red arrows indicate the mean directions and blue circles the 90% CI. (c,d) The headings at the familiar release point are replotted linearly. Left axis shows the angle from the nestward heading with PI direction at 110°, and the right axis shows the weighting given to PI. Overlaid are the best fits of the various models. (c) Ants' headings with various PI lengths for nest 1 (grey) and nest 2 (white). Mean headings (black) match best weightings predicted by optimal integration based on PI directional uncertainty (red curve). (d) Ants' headings for the 3 m (grey) and 3 m ‘pot’ (blue) groups. Red dot shows the weighting predicted by PI directional uncertainty for 3 m ‘pot’ group. Instead, mean headings of both groups (white dots) closely match previous data (black dots), suggesting that ants use the vector length to weigh PI. (Online version in colour.)

