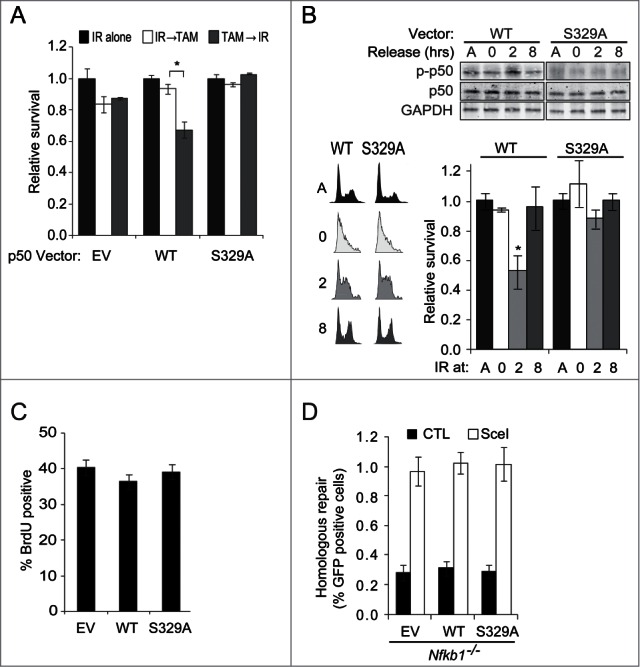
Figure 5.

p50 phosphorylation in response to ATR sensitizes cells to DNA strand breaks. (A and B) Clonogenic assays. (A) Nfkb1−/−MEFs expressing TopBP1ER and the p50 vector shown were exposed to 0.5 Gy IR and TAM, in the order indicated, separated by 8 hrs. Inset: IB showing p50 expression. Data is normalized to IR alone, ± SEM of duplicate samples from 3 experiments (TAM alone does not alter survival). *P < 0.02. (B) Thymidine synchronized Nfkb1−/−MEFs stably expressing p50WT or p50S329A were exposed to 0.5 Gy IR at indicated time following release. A- asynchronous cells. IB of nuclear lysates (upper) and FACS analysis (left) from the same experiment is shown (anti-p50 IB in asynchronous shows equal p50 expression). *P < 0.02, relative to p50S329A. (C) FACS analysis of BrdU labeling in asynchronous Nfkb1−/−MEFs expressing empty vector, p50WT or p50S329A. Mean ± SD of triplicate samples from 3 experiments shown. n ≥ 105 cells per group. (D) HR assay in Nfkb1−/−MEFs stably expressing empty vector (EV), p50WT or p50S329A following co-transfection with DR-GFP and either control vector (CAG) or pC⇓ASce (SceI). Data show value ± SD of triplicate samples (n = 3000− 5000 cells per group).
