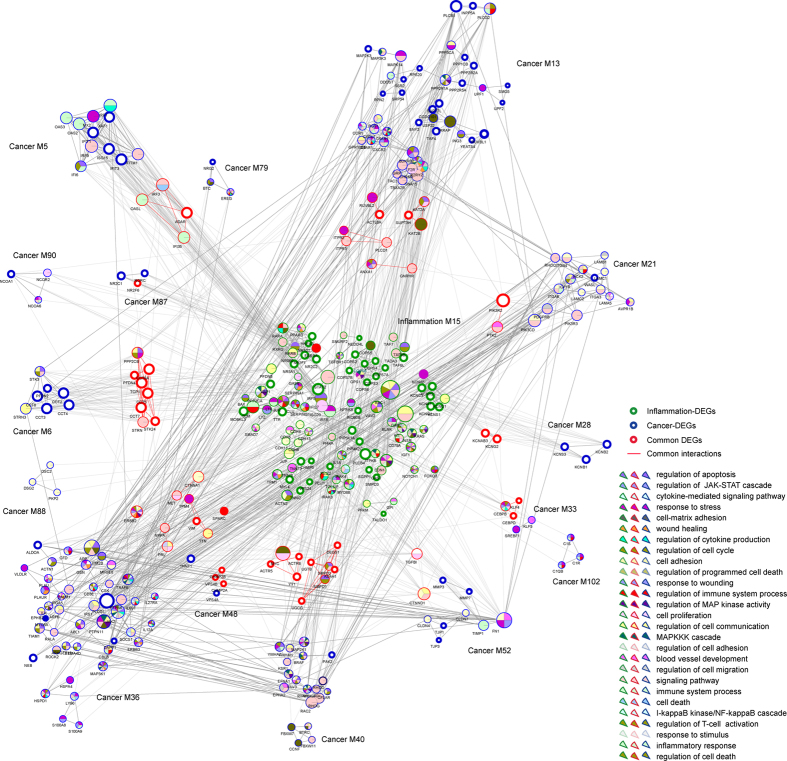
Figure 3. Cancer communicates with inflammation through significant crosstalk interactions.
The central inflammation module is surrounded by several cancer modules, with common interactions shown in red. The border of nodes are colored as inflammation, cancer or common DEGs, with node size corresponding to their network degree. Functions enriched by inflammation-, cancer- or common DEGs are also colored shown inside each node. Module No. is listed beside corresponding module.

