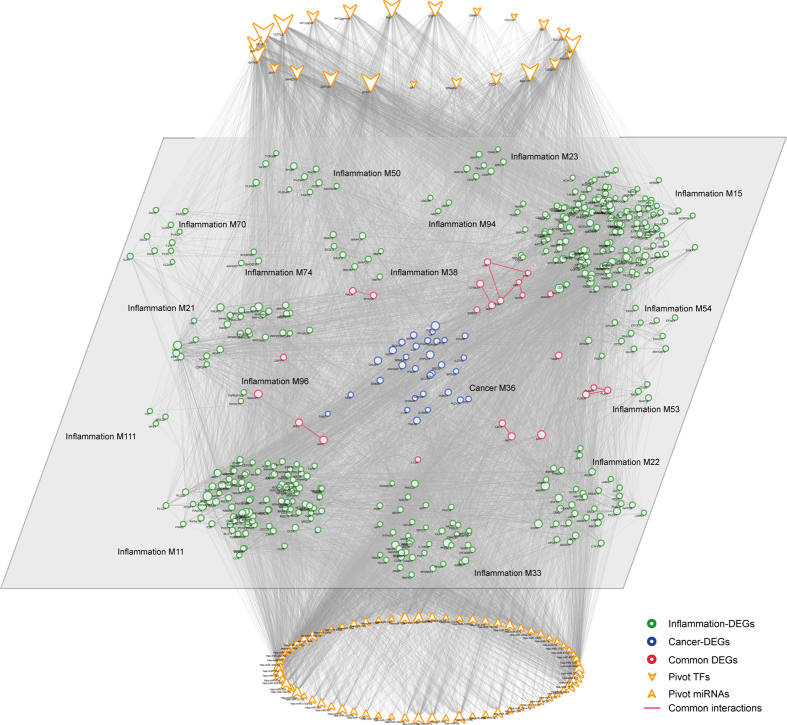
Figure 4. Inflammation contributes to cancer bridged by pivot TFs and miRNAs.
Pivot regulators were identified based on both the number of their interactions within the module pair, and the significant enrichment of their regulated genes within per module. Pivot TFs are shown in the upper level of the network, with pivot miRNAs in the lower level. Module subnetwork comprises a central cancer module and several inflammation modules, with module No. beside them. The border of network nodes are colored as inflammation, cancer or common DEGs, with common interactions shown in red. Node size corresponds to its network degree.

