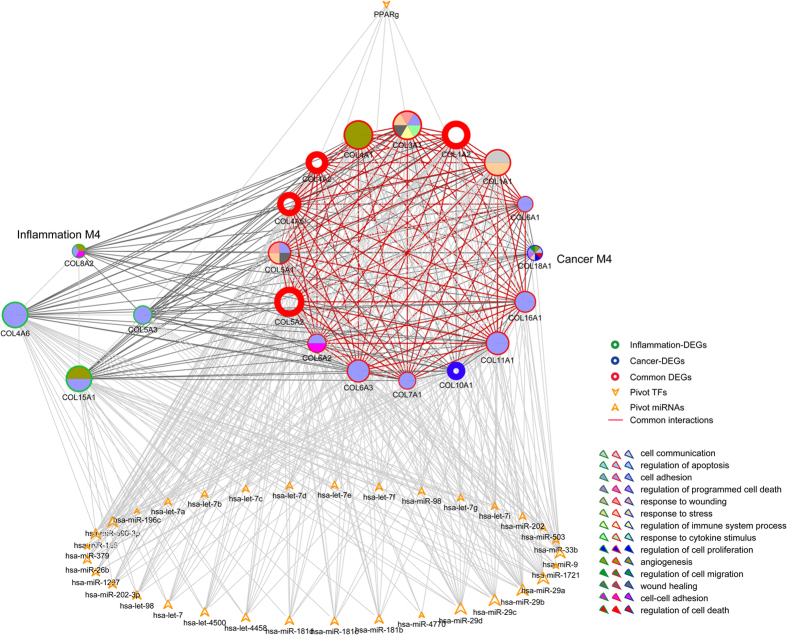
Figure 6. Module subnetwork showing both significant overlapping and crosstalk interactions.
Module subnetwork contains one inflammation and one cancer module, with significant enriched functions colored inside each node. Pivot TFs and miRNAs were also extracted for the module subnetwork. The border of network nodes are colored as inflammation, cancer or common DEGs, with common interactions shown in red.

