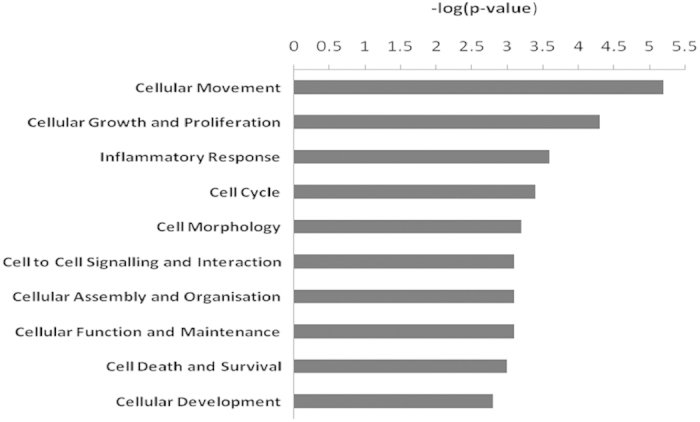
Figure 1. Molecular and cellular functions in the human degenerative versus non-degenerative annulus fibrosus.

The bar graph image obtained from IPA ingenuity pathway analysis system shows the 10 most dysregulated molecular and cellular functions identified from microarray data of human degenerative versus non-degenerative annulus fibrosus. N = 16 for degenerative; N = 8 for non-degenerative samples.
