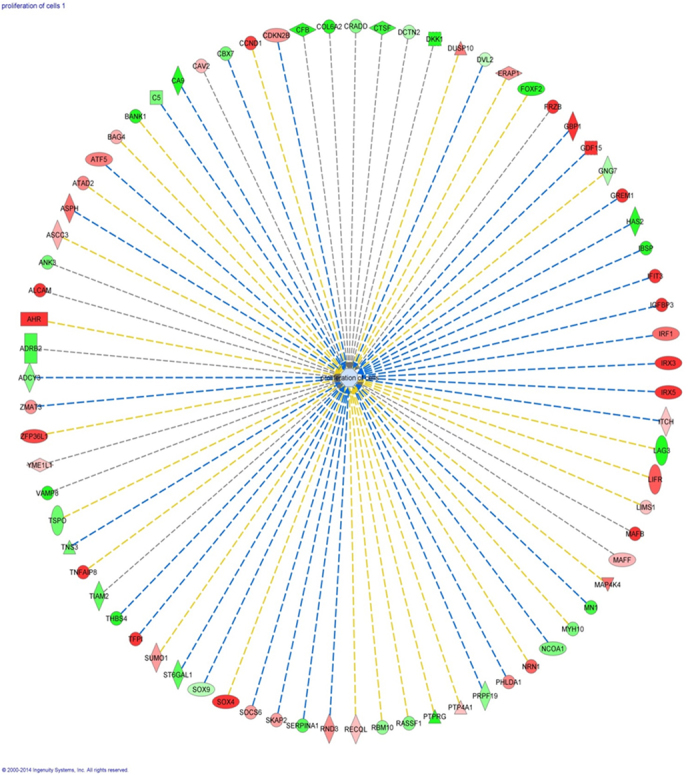
Figure 2. Cell proliferation network in the human degenerative versus non-degenerative annulus fibrosus.

The scheme is the result of microarray data analysis by the IPA ingenuity pathway analysis system showing 77 significantly dysregulated genes that are involved in the cellular growth and proliferation network. Red represents up-regulation of genes, while green represents down-regulation of genes. Light red or green represent slight up-regulation or down-regulation. Different shapes have different designations as indicated under http://ingenuity.force.com/ipa/articles/Feature_Description/Legend.
