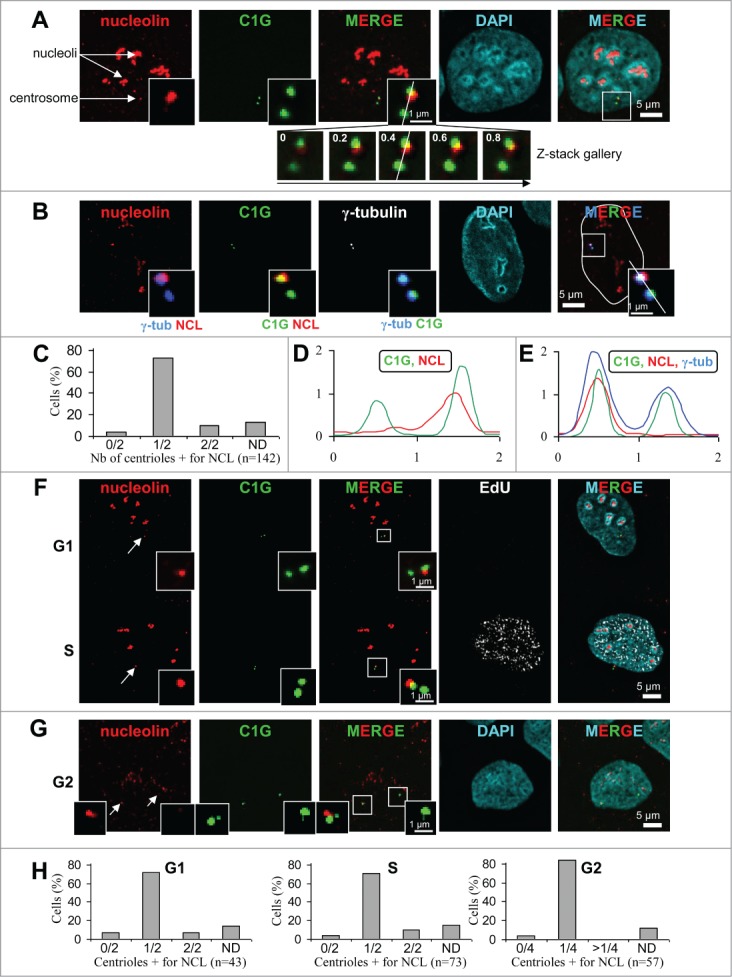
Figure 1 (See previous page).

Nucleolin decorates one of the 2 centrioles throughout interphase in U2OS-centrin-1-GFP cells. (A) Co-visualization of nucleolin, centrin-1-GFP (C1G) and nuclear counterstain (DAPI) shown as individual projections and as a 2- and 3-color merged projections. Nucleolin was detected with a monoclonal antibody and revealed with an Alexa555 secondary antibody [red] and centrin-1-GFP detection was enhanced with a GFP booster [green], while nuclei were counterstained with DAPI [cyan]. On the top left image, arrows show nucleoli and the centrosome area. Enlarged images of the centrosome area (boxed on the 3 color image) are shown as insets. Full size images and insets on the first row correspond to the projection of 5 consecutive optical sections centered on the focal plane, that have been previously submitted to a 3D constrained iterative deconvolution process. Insets on second row correspond to the individual optical sections of the centrosome area, separated by 0.2 μm steps, used to obtain the projection on the first row. Scale bars represent 5 μm on full size images and 1 μm on enlarged insets. (B) Co-visualization of nucleolin, γ-tubulin, centrin-1-GFP (C1G) and nuclear counterstain (DAPI) shown as individual projection and as a 3-color merged projection with nuclear outline. Nucleolin, centrin-1-GFP and DAPI were detected similarly as in A, while γ-tubulin was detected with a primary antibody directly coupled to TRITC [in white on the unmerged image and in blue on merged images]. Enlarged projections of the centrosome area (boxed on the 3 color image) are shown as 2-color insets. Scale bars represent 5 μm on full size images and 1 μm on enlarged insets. (C) Quantification of the number of centrioles (centrin-1-GFP label) positive for nucleolin per cell, for A and B experiments. Cells exhibiting 0/2, 1/2 and 2/2 centrioles labeled are reported as percentages of the number n of cells analyzed. ND stands for “not determinable” and mainly corresponds to cases where the centrosomal signal is superimposed to the strong nucleolar signal obtained with nucleolin. (D and E) Fluorescent intensity profiles, along a line (displayed on the 0.4 μm section of the z-stack gallery in A for D and on the 3-color inset in B for E) of an individual section of the centrosome area, obtained for nucleolin [NCL, red], centrin-1-GFP [C1G, green] and for E, γ-tubulin [blue]. The x axes represent the distance along the line in μm and the y axes correspond to fluorescence intensity in arbitrary units. (F and G) Co-visualization of nucleolin and centrin-1-GFP (C1G) shown as individual projections and as a 2-color merged projection in G1 and S cell cycle phases (F) and in G2 phase (G). Asynchronously growing cells were selected under the microscope thanks to the 4 centrin dots specific of G2 cells (see 2 arrows pointing to the 2 separated centrosomes on left image). Asynchronously growing cells were incubated with the nucleotide analog EdU for 30 min before fixation, detected with Alexa647 [white] and visualized as an individual projection and on the 4-color merged projection in F. Nucleolin, centrin-1-GFP and DAPI were detected similarly as in A. Enlarged projections of the centrosome area (boxed on the 2 color merged image) are presented in the insets. Scale bars represent 5 μm on full size images and 1 μm on enlarged insets. (H) Quantification of the number of centrioles (centrin-1-GFP label) positive for nucleolin per cell, for F and G experiments, in G1 (left), S (middle) or G2 (right) cell cycle phases. G1 and S cells exhibiting 0/2, 1/2 and 2/2 centrioles labeled are reported as percentages of the number n of cells analyzed. G2 cells exhibiting 0/4, 1/4 and more than 4 (>1/4) centrioles labeled are reported as percentages of the number n of cells analyzed. As in C, ND stands for “not determinable."
