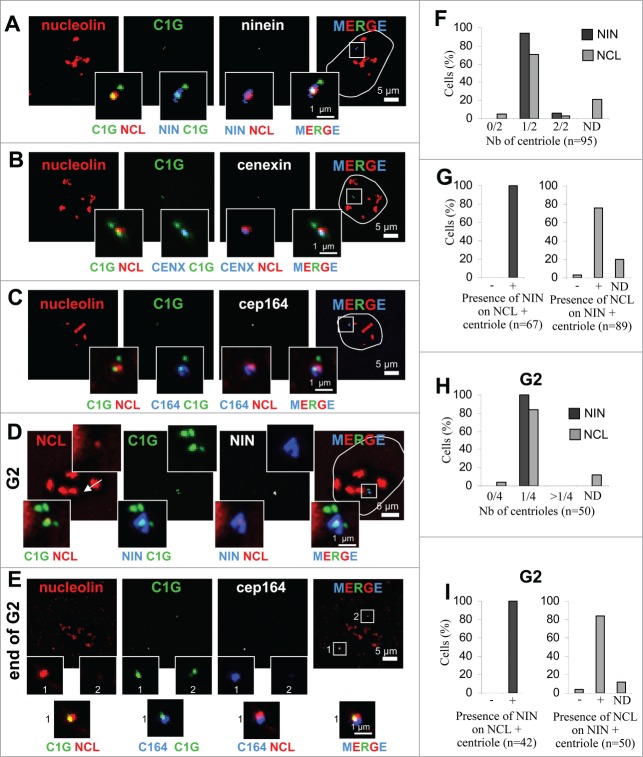
Figure 3 (See previous page).
Non-random distribution of nucleolin toward the mature centriole. (A–C) Co-visualization of nucleolin and centrin-1-GFP (C1G) together with ninein (A), cenexin (B) or CEP164 (C) in U2OS-centrin-1-GFP cells. Enlarged images of the centrosome area (displayed on the 3 color merged images) are presented in the insets as 2 color merged images to facilitate colocalization visualization. (D, E) Co-visualization of nucleolin (NCL) and centrin-1-GFP (C1G) together with ninein (NIN, D) and with CEP164 (C164, E) in U2OS-centrin-1-GFP cells, exhibiting 4 centrin dots, characteristic of G2 cells. The arrow on the left image shows the centrosome area. Enlarged images of the centrosome area (displayed on the 3 color merged images) are presented in the upper insets for a single channel and in the lower insets as 2 color merged images to facilitate colocalization visualization. In A-E, nucleolin was detected with a monoclonal antibody (detected with a secondary antibody coupled to Alexa647) [red]; centrin-1-GFP detection was enhanced with a GFP booster [green], while ninein, cenexine and CEP164 were detected with polyclonal antibodies (detected with a secondary antibody coupled to Alexa555) [in white on the unmerged image and in blue on merged images]. Outline of the nuclei, counterstained with DAPI (not shown) is highlighted on the merged images. Scale bars represent 5 μm on full size images and 1 μm on enlarged insets. (F) Quantification of the number of centrioles (centrin-1-GFP label) positive for ninein [dark bars] and nucleolin [gray bars] per cell in G1/S cell cycle phase, from experiment in A. Cells exhibiting 0/2, 1/2 and 2/2 centrioles labeled for each marker are reported as percentages of the number n of cells studied. ND stands for not determinable and mainly corresponds to cases where the centrosomal signal of nucleolin is superimposed to the strong nucleolar signal. (G) Quantification of co-distribution between both centrosomal markers, recorded in F. The presence of ninein on nucleolin positive centrioles is shown on the left, while the presence of nucleolin on ninein positive centrioles is shown on the right, expressed as percentages of the number n of cells studied. Similarly as in F, ND stands for “Not Determinable." (H) Quantification of the number of centrioles (centrin-1-GFP label) positive for ninein [dark bars] and nucleolin [gray bars] per cell in G2 cell cycle phase, from experiment in D and E. Cells exhibiting 0/4, 1/4 and >1/4 centrioles labeled for each marker are reported as percentages of the number n of cells studied. As in F, ND stands for “Not Determinable." (I) Quantification of co-distribution between both centrosomal markers, recorded in H. The presence of ninein on nucleolin positive centrioles is shown on the left, while the presence of nucleolin on ninein positive centrioles is shown on the right, expressed as percentages of the number n of cells studied. As in F, ND stands for “Not Determinable."

