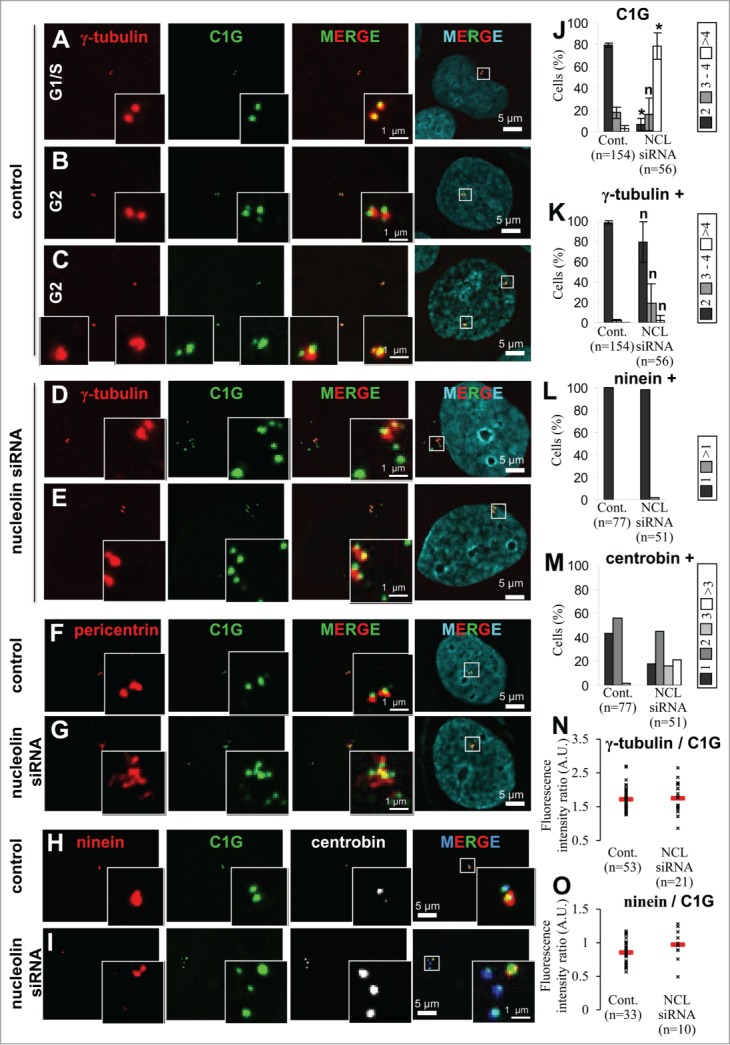
Figure 4 (See previous page).

Nucleolin depletion leads to amplification of immature centriole markers. (A–E) Presence of centrosome amplification in nucleolin-silenced cells during interphase. Co-visualization of γ-tubulin, centrin-1-GFP (C1G) and nuclear counterstain (DAPI) shown as individual projections and as a 2- and 3-color merged projections in untransfected control (A, B and C) or nucleolin siRNA transfected (D, E) U2OS-centrin-1-GFP cells. Cells were harvested 4 days after transfection. Centrin-1-GFP detection was enhanced with a GFP booster [green] and γ-tubulin was detected with a primary antibody directly coupled to TRITC [red]. Nuclei were counterstained with DAPI [cyan]. Asynchronously growing cells were selected under the microscope with reference to the number of centrin dots (2 dots for G1/S cells and 4 dots for G2 cells). Early G2 and late G2 control cells are shown in B and C respectively. Enlarged projections of the centrosome area (boxed on the 3-color image) are shown as insets. Scale bars represent 5μm on full size images and 1 μm on enlarged insets. (F, G) Nucleolin silencing leads to an amplification of pericentrin. Co-visualization of centrin-1-GFP (C1G) and pericentrin in untransfected control (F) or in nucleolin-silenced (G) U2OS-centrin-1-GFP cells. Cells were harvested 4 days after transfection. Centrin-1-GFP detection was enhanced with a GFP booster [green] and pericentrin was detected with a monoclonal antibody (detected with a secondary antibody coupled to Alexa555) [red]. Nuclei were counterstained with DAPI [cyan]. Enlarged images of the centrosome area (displayed on the 3 color merged images) are presented in the insets. Scale bars represent 5 μm on full size images and 1 μm on enlarged insets. (H, I) Nucleolin silencing leads to a specific amplification of centriole immature mark. Co-visualization of centrin-1-GFP (C1G) with ninein and centrobin in untransfected control (H) or in nucleolin-silenced (I) U2OS-centrin-1-GFP cells. Cells were harvested 4 days after transfection. Centrin-1-GFP detection was enhanced with a GFP booster [green], ninein was detected with a polyclonal antibody (detected with a secondary antibody coupled to Alexa 555) [red] and centrobin was detected with a monoclonal antibody (detected with a secondary antibody coupled to Alexa 647) [in white on the unmerged images and in blue on the merge images]. Nuclei were counterstained with DAPI [cyan]. Enlarged images of the centrosome area (displayed on the 3 color merged images) are presented in the insets. Scale bars represent 5 μm on full size images and 1 μm on enlarged insets. (J, K) Quantification of the number of centrin-1-GFP dots (C1G, J), and of γ-tubulin positive centrin-1-GFP dots (γ-tubulin +, K) per cell in untransfected control (Cont., left) or nucleolin siRNA transfected (NCL siRNA, right), for A-E experiments. Cells exhibiting 2 dots [dark bars], 3 or 4 dots [gray bars] and more than 4 dots (>4) [white bars] are expressed as percentages of the number n of cells studied. The error bars correspond to standard deviations calculated for 3 independent experiments. *: Significant difference with a p value < 0.01 with control populations (left columns). n: non-significant difference with a p value < 0.01 with control populations (left columns). (L, M) Quantification of the number of ninein positive centrin-1-GFP dots (ninein +, L) and of centrobin positive centrin-1-GFP dots (centrobin +, M) per cell in untransfected control (Cont., left) or nucleolin siRNA transfected (NCL siRNA, right), for H and I experiments. Cells are distributed in different classes according to their number of dots (see individual legends), whose values are expressed as percentages of the number n of cells studied. (N, O) Quantification of γ-tubulin and ninein at the centrosome in absence of nucleolin. γ-tubulin (N) or ninein (O) fluorescence intensity were measured at the centrosome in untransfected control or nucleolin siRNA transfected U2OS-centrin-1-GFP cells. Fluorescence intensities of γ-tubulin or ninein were measured on the centrin-1-GFP dots positive for γ-tubulin or ninein respectively. These intensities were normalized to that of centrin-1-GFP. For each condition, the mean value is reported on the graph with standard deviation error bars.
