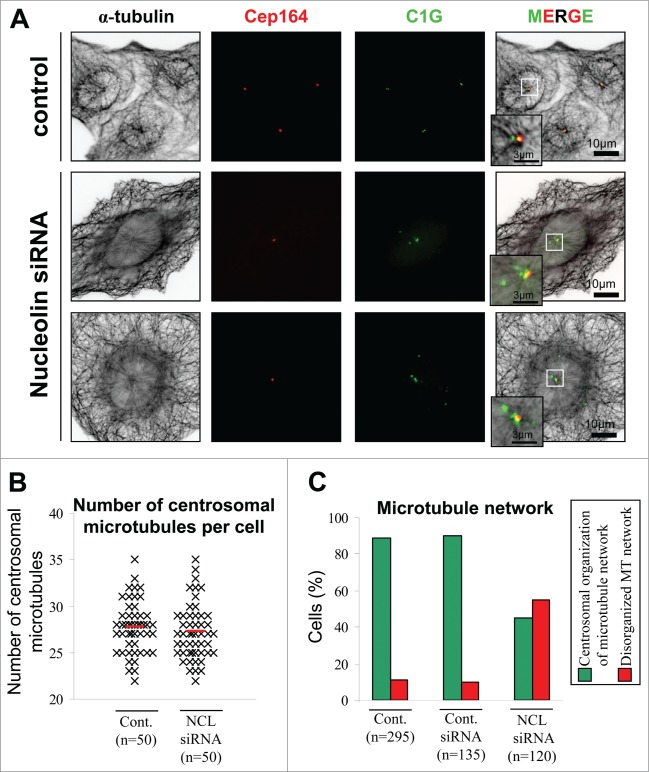
Figure 6.
Microtubule network is disorganized in nucleolin depleted cells. (A) Co-visualization of α-tubulin, CEP164 and centrin-1-GFP (C1G) shown as individual projections and as 3-color merged projections in control or nucleolin siRNA transfected U2OS-centrin-1-GFP cells. Cells were harvested 4 days after transfection. Centrin-1-GFP detection was enhanced with a GFP booster [green], CEP164 was detected with a polyclonal antibody (detected with a secondary antibody coupled to Alexa647) [red] and α-tubulin was detected with a monoclonal antibody (detected with a secondary antibody coupled to Alexa555) [black]. Enlarged projections of the centrosome area (boxed on the 3-color image) are shown as insets. Scale bars represent 10 μm on full size images and 3 μm on enlarged insets.(B) Quantification of the number of microtubules emanating from the centrosome of untransfected control (cont.) and nucleolin siRNA transfected (NCL siRNA) U2OS-centrin-1GFP cells. Each black mark corresponds to a cell (cont. n = 50 and NCL siRNA n = 50) and the red lines correspond to the mean (cont. 27.72 +/− 2.74 and NCL siRNA 27.24 +/− 2.97). (C) Quantification of the changes in the interphase microtubule network organization following nucleolin depletion from experiment in A. The histogram shows the percentage of the number n of U2OS-centrin-1-GFP cells analyzed for untransfected control (cont., left), control siRNA transfected (Cont. siRNA, middle), or nucleolin siRNA transfected (NCL siRNA, right), harboring a microtubule network mainly organized from the centrosome [green bars, see example on first row of A], or disorganized [red bars, see examples on second and third row of A].

