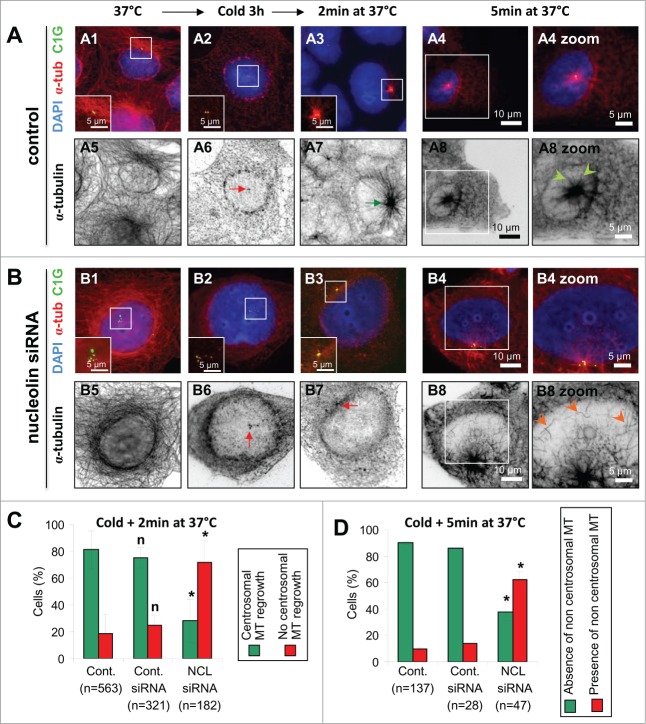
Figure 7 (See previous page).
Alteration of microtubule regrowth in nucleolin-silenced cells after depolymerization. (A-B) Microtubule regrowth after microtubule induced depolymerization in untransfected control (A) and nucleolin siRNA transfected (B) U2OS-centrin-1-GFP cells. Co-visualization of α-tubulin (α-tub), centrin-1-GFP (C1G) and nuclear counterstain (DAPI) shown as 3-color merged projections (first row) and as individual sections for α-tubulin (inverted dynamics, second row) before depolymerization (A1, A5, B1 and B5), immediately after depolymerization (A2, A6, B2 and B6), after 2 minutes at 37°C (A3, A7, B3 and B7), and finally after 5 minutes at 37°C (A4, A8, B4, B8, and zooms A4, A8, B4, and B8). Centrin-1-GFP detection was enhanced with a GFP booster [green]; α-tubulin was detected with a monoclonal antibody (detected with a secondary antibody coupled to Alexa555) [red on the 3-color merged images and black on individual projections]. Enlarged projections of the centrosome area (boxed on the 3-color images) are shown as insets (A1-A3 and B1-B3) or as full sized pictures (A4, A8, B4, and B8 zooms). Arrows pointing to the centrosomal area appear red when no microtubule regrowth is observed (A6, B6 and B7) or green when microtubule regrowth is observed (A7). Arrowheads pointing to microtubules appear light green when microtubules are directed to the centrosomal area (A8 zoom) or orange when microtubules are not pointing to the centrosomal area (B8 zoom). Scale bars represent 10 μm on full size images, 5 μm on the zoomed images and the insets. (C–D) In C, quantification of the cells incubated for 2 minutes at 37°C (A7 and B7) exhibiting either microtubules regrowth (green bars on C, see also green arrows in A7) or no microtubule regrowth (red bars on C, see also red arrows in B7). In D, quantification of the cells incubated for 5 minutes at 37°C (A8 and B8) exhibiting either absence (green bars on D, see also cells with only green arrowheads on A8 zoom) or presence of cytoplasmic microtubules (orange bars on D, see also cell with orange arrowheads on B8 zoom). These classes are displayed for untransfected control cells (Cont., left), cells transfected with control siRNA (Cont. siRNA, middle) and nucleolin siRNA transfected cells (NCL siRNA, right), whose values are expressed as percentages of the total number n of cells studied. Error bars represent the standard deviation from 4 independent experiments. *: Significant difference with a p value < 0.01 with control populations (left columns). n: non-significant difference with a p value < 0.01 with control populations (left columns).

