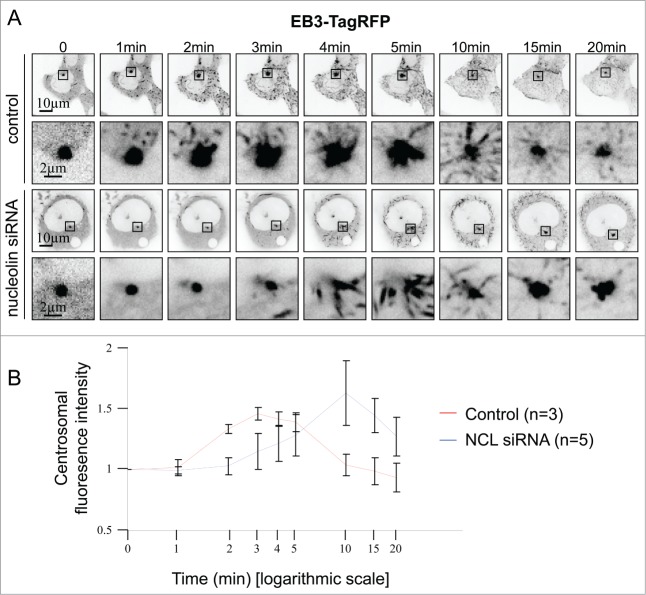
Figure 8.
Analysis of microtubule regrowth after depolymerization using the microtubule plus-end tracking protein EB3-tagRFP. (A) Still frames from time-lapse experiments show EB3-tagRFP expressing untransfected control and nucleolin siRNA transfected U2OS-centrin-1-GFP cells, after microtubule depolymerization. Enlarged images of the centrosome area (displayed on the full size images) are shown under the full size images. For each time point (except for t = 0min), a projection of 10 temporal images prior to the image matter was performed. Scale bars represent 5 μm on full size images and 2 μm on enlarged images. Times are given in minutes (full videos are available in supplementary material as video S1 and S2). (B) Quantification of centrosomal fluorescence intensity at the indicated times in untransfected control and nucleolin siRNA transfected U2OS-centrin-1-GFP cells, after microtubule depolymerization from A. Mean values of 3 control [red line] and 5 nucleolin depleted (NCL siRNA) [blue line] cells were plotted.

