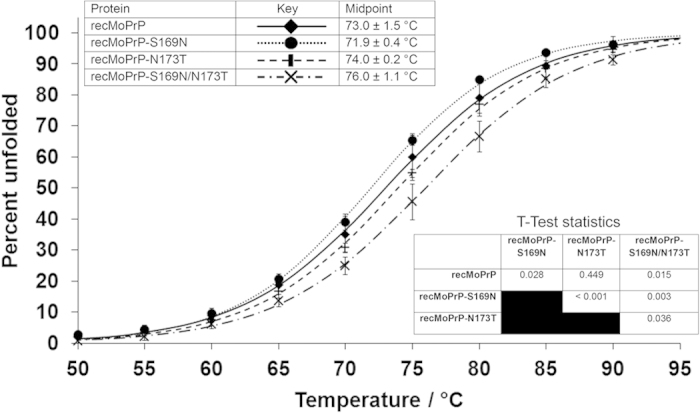
Figure 5. Thermal denaturation profiles of recombinant PrP variants as monitored by circular dichroism spectropolarimetry at 222 nm.

The normalised ellipticity at 222 nm is plotted against temperature and a sigmoidal curve fitted. Error bars are standard deviations from n > = 5 replicate analyses. T-Test statistics test differences between midpoints of each curve.
