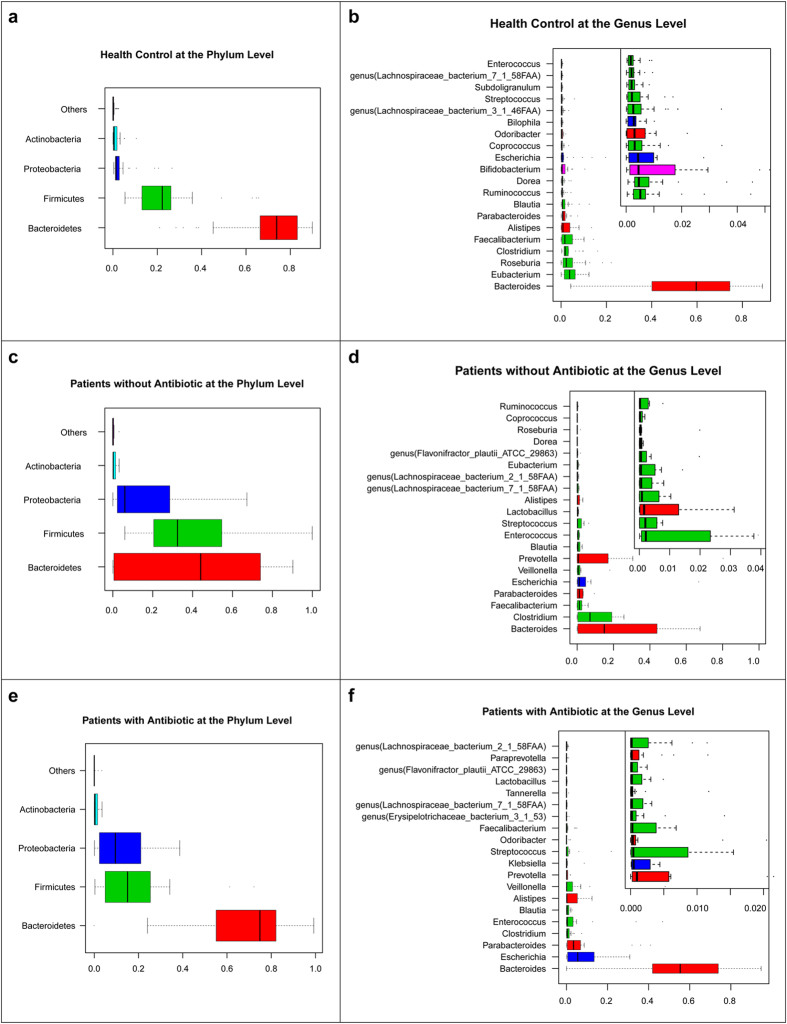
Figure 1. Human gut microbiome abundances and phylogenetic profiles at the phylum and genus levels for healthy controls, H7N9 infected patient with antibiotics and without antibiotics.
(a) A phylum abundance variation box plot for the top abundant phylum in the healthy controls is shown. The boxes represent the inter quartile range (IQR), from the first and third quartiles, and the inside line represents the median. The whiskers denote the lowest and highest values within 1.53 IQR from the first and third quartiles. The circles represent outliers beyond the whiskers. (b) The 20 most abundant genera in the healthy controls are shown. The colour of each genera corresponds with the colour of its respective phylum. (c) A phylum abundance variation box plot for the top abundant one in the patients with antibiotics is shown. (d) The 20 most abundant genera in the patients with antibiotics are shown. (e) A phylum abundance variation box plot for the top abundant phylum in the patients without antibiotics is shown. (f) The 20 most abundant genera in the patients without antibiotics are shown.

