
Figure 3. Phylogenetic abundance comparison from selected genus and species and biological diversity comparison among healthy controls, H7N9 infected patient with antibiotics and without antibiotics.
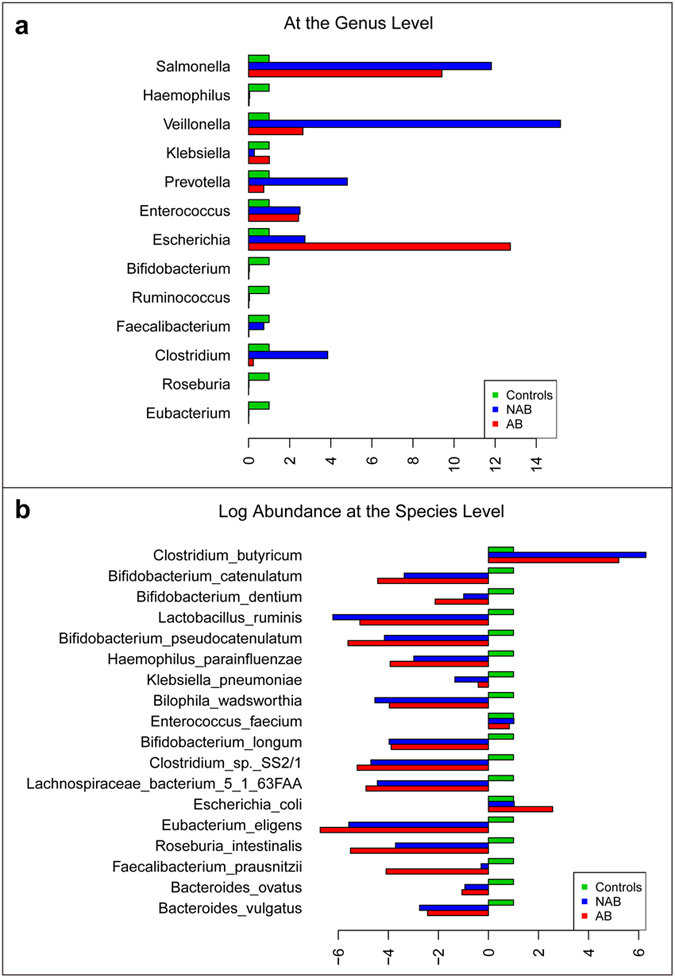
(a) Phylogenetic median relative abundance comparison from selected genus is shown. The abundance in healthy controls for each genusis set to 1. (b) Phylogenetic median relative abundance comparison from selected species is shown. The abundance in healthy controls for each species is set to 1. Log scale is used in X axis, bars on the left showing those species with lower abundance than that in healthy controls.